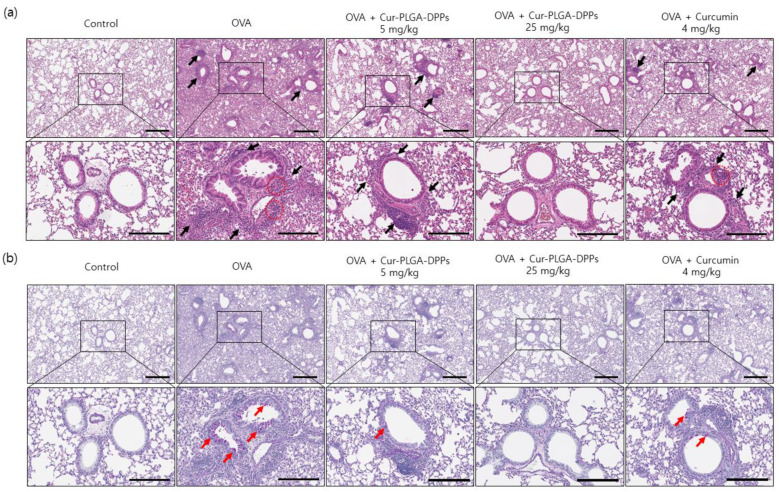
Figure 6.
Histological analysis of the effects of Cur-PLGA-DPPs on OVA-induced asthmatic mice. (a) Representative results for the H&E staining of lung tissue. Black arrows indicate peribronchial dense inflammatory infiltration; red circles indicate prominent eosinophil infiltration. The scale bars represent 400 µm (upper panel) and 200 µm (lower panel). (b) Representative PAS staining of lung tissue. Red arrows indicate increased purple-colored PAS-positive mucin-containing goblet cells (goblet-cell hyperplasia). The scale bars represent 400 µm (upper panel) and 200 µm (lower panel).

