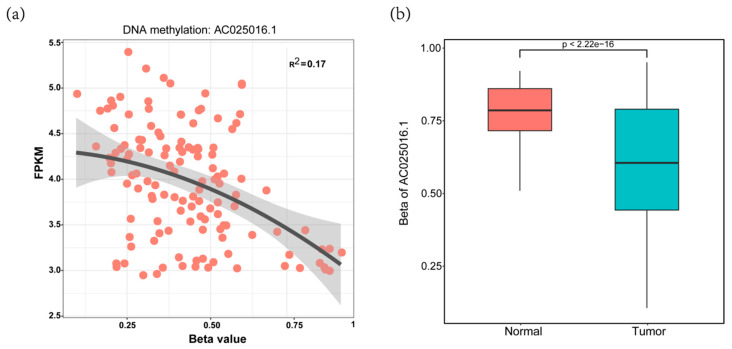
Figure 5.
Example of a lncRNA driven by DNA methylation. (a) the AC025016.1 expression level (FPKM) was inversely correlated with its promoter methylation level (β value); (b) Boxplot showing that the β values of primary tumor samples were significantly higher than those of normal tissue samples.

