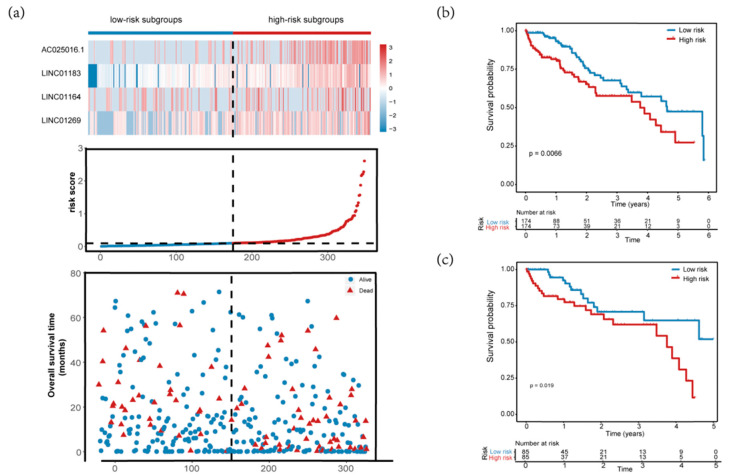
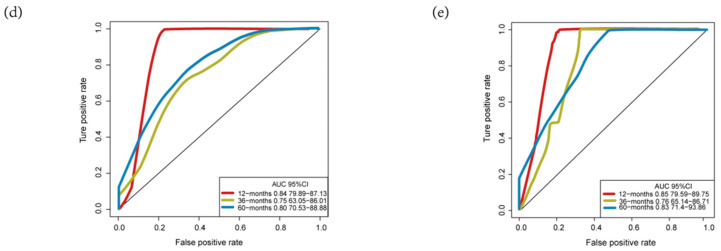
Figure 6.
Assessment of four-MDELs HCC signature prognostic risk score model. The patients were stratified into high risk group and low risk group based on median of risk score. (a) Risk score distribution of HCC patients, Survival status of each patient and Expression heatmap of the four-MDELs corresponding to each sample above. Red: high expression and risk; Blue: low expression and risk; (b,c) Kaplan-Meier estimates of the OS time of the patients in the training set and the validation set using the four-MDELs signature-based risk score; (d,e) The ROC curve of the training set and validation set for 1-,3- and 5-year survival prediction.


