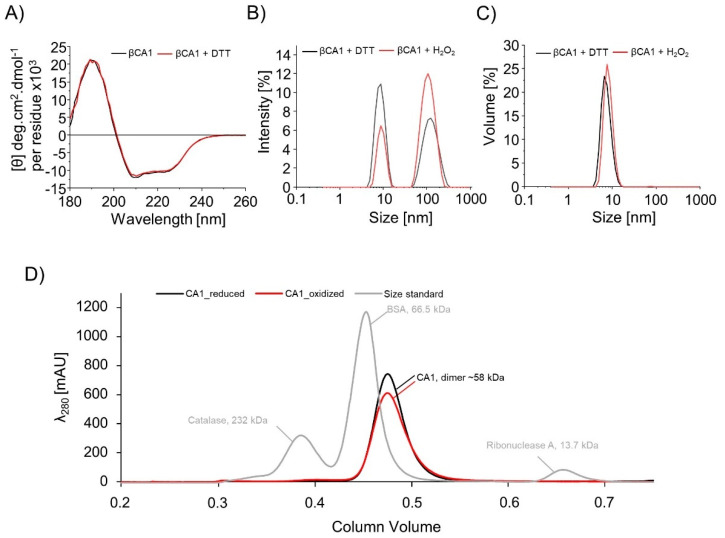
Figure 2.
Determination of the oligomeric state of βCA1. (A) Superimposed far UV spectra of βCA1 with or without 10 mM DTT. (B) Dynamic light scattering (DLS) curves representing the βCA1 light diffusion intensity as function of the size in nm and (C) the βCA1 volume signal as function of the size in nm. βCA1 (320 µM) was analyzed by DLS after treatment with 20 mM DTT and 500 µM H2O2, respectively. (D) Size exclusion chromatography of βCA1 after treatment with 50 mM DTT and re-oxidation with 100 µM H2O2. Reduced βCA1 is shown as black line and oxidized βCA1 is shown as red line, size standard of the SEC run is shown in gray.

