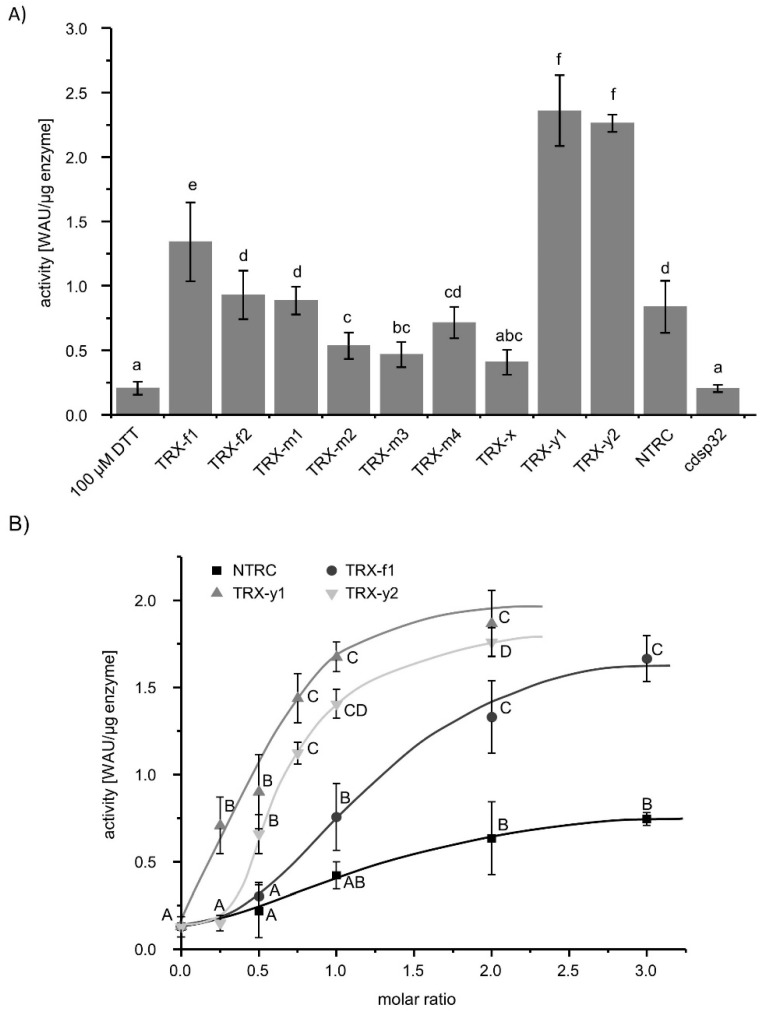
Figure 3.
Activation of βCA1 by thioredoxin (TRX). (A) Activity of βCA1 after 30 min incubation with 100 µM DTT with or without equimolar amounts of different chloroplast TRXs. Data represent the mean of n ≥ 10 ± SD from two independent protein purifications. Letters a-g indicate significant differences of p ≤ 0.05 calculated with one-way ANOVA and post hoc Tukey HSD. (B) Concentration dependent influence of TRX-f1, TRX-y1, TRX-y2, and NTRC on the activity of βCA1. βCA1 was incubated with 100 µM DTT and the indicated molar ratio of the TRXs for 30 min and then subjected to the activity measurement. The values represent the mean of n ≥ 8 ± SD from two independent protein purifications. The letters A-D indicate significant differences of p ≤ 0.05 within each TRX-dependent activity measurement of βCA1. Calculation was done with one-way ANOVA with post hoc Tukey HSD test.

