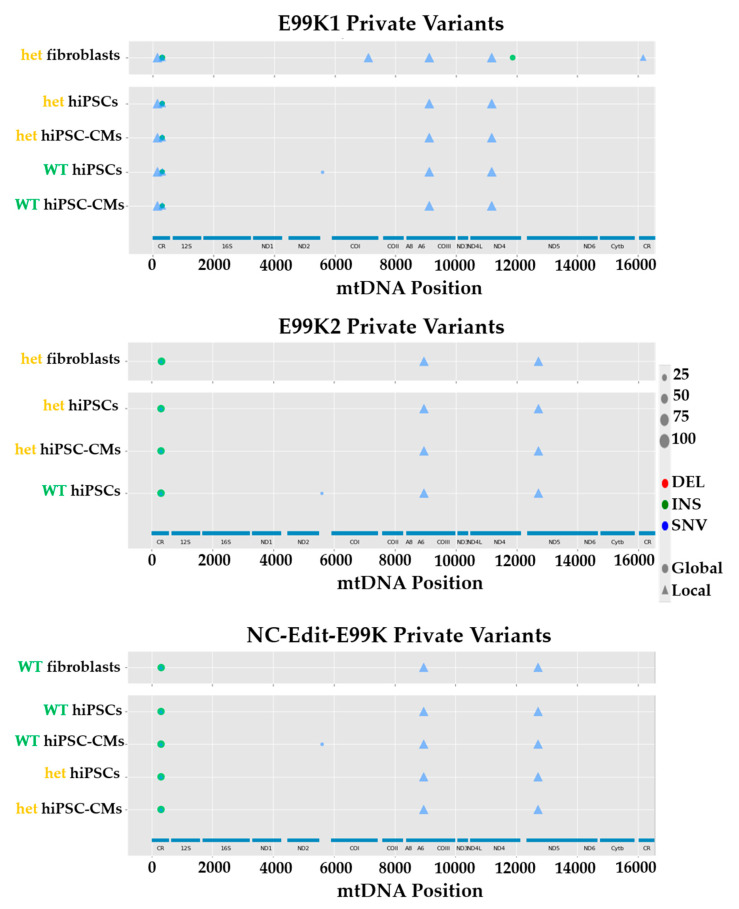
Figure 3.
mtDNA NGS of three separate isogenic sets bearing the p.E99K-ACTC1 mutation. Analysis of mtDNA sequence of isogenic sets of fibroblasts, hPSCs and hPSC-CMs of E99K1 (top), E99K2 (middle) and NC-Edit-E99K (bottom) identified variants specific to the starting cell sources. Legend map on the right side indicates type of mtDNA mutation (DEL, deletion; INS, insertion; SNV, single nucleotide variant) and percent heteroplasmy is correlated with the size of the symbol. (WT, wild-type; het, heterozygous).

