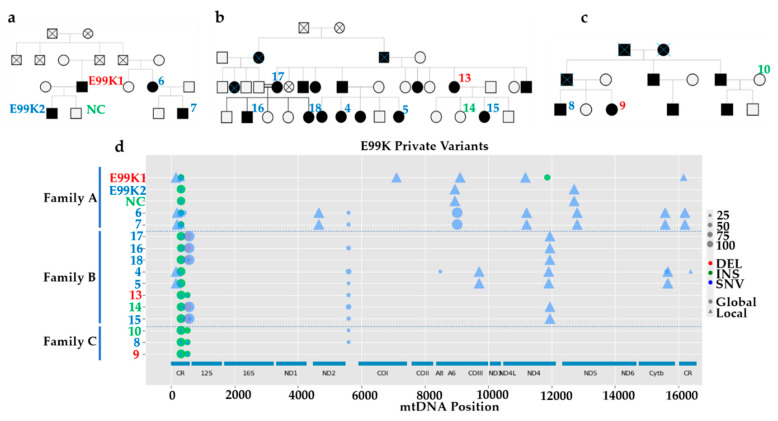
Figure 5.
Analysis of mtDNA variants in unrelated HCM patients. (a–c) Pedigree chart of three unrelated families where the p.E99K-ACTC1 mutation is common (red numbers indicate more severe phenotypes and green numbers milder ones). (d) NGS sequencing analysis of mtDNA of fibroblasts derived from patient skin biopsies identified variants shared between patients or specific to individual families. Legend map on the right side indicates type of mtDNA mutation (DEL, deletion; INS, insertion; SNV, single nucleotide variant) and percent heteroplasmy is correlated with the size of the symbol.

