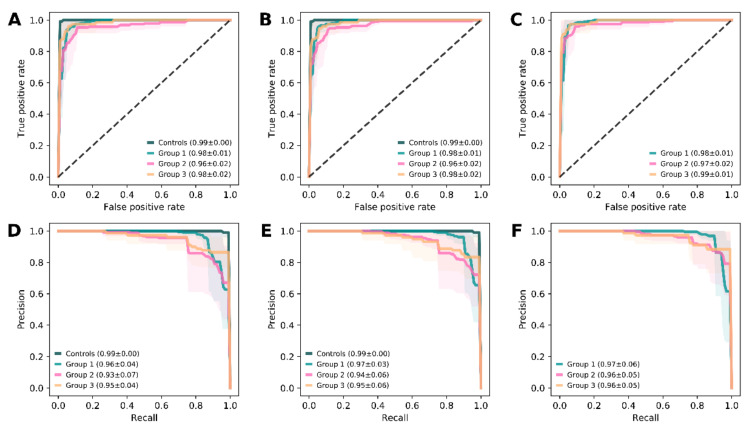
Figure 3.
Model performance for the prediction of panretinal function. Receiver operating characteristic (ROC) curves that describe the true positive rate versus the false positive rate (top row, A–C), and graphs that plot the precision against the recall (bottom row, D–F) are demonstrated for the models predicting panretinal function based on feature set A (first column, A and D), B (second column, B and E), and C (third column, C and F). The lines represent the mean (± standard deviation, shaded area) of all folds for each group category according to full-field electroretinogram results, and the given values are the respective area under the curve (mean ± standard deviation). The plots and respective values demonstrate the high robustness and power of the models to predict the panretinal function. The use of pure retinal thickness data (feature set A, first column) already reached the performance level of the models using additional features (feature set B, second column; feature set C, third column).

