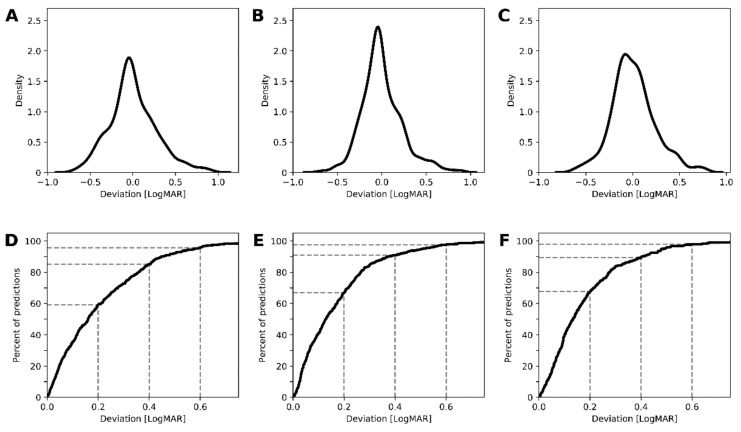
Figure 5.
Model performance for the prediction of best corrected visual acuity (BCVA). The density plots that demonstrate the deviation of the predictions from the measured BCVA values (top row, A–C), and graphs that plot the cumulative true positive rate against the deviation (bottom row, D–F), are demonstrated for the models based on feature set A (first column, A and D), B (second column, B and E), and C (third column, C and F). The inclusion of foveal status with (feature set C, third column) or without (feature set B, second column) demographic data improved the performance of the ensemble machine learning algorithms compared to pure retinal thickness data (feature set A, first column). LogMAR: Logarithm of the Minimum Angle of Resolution.

