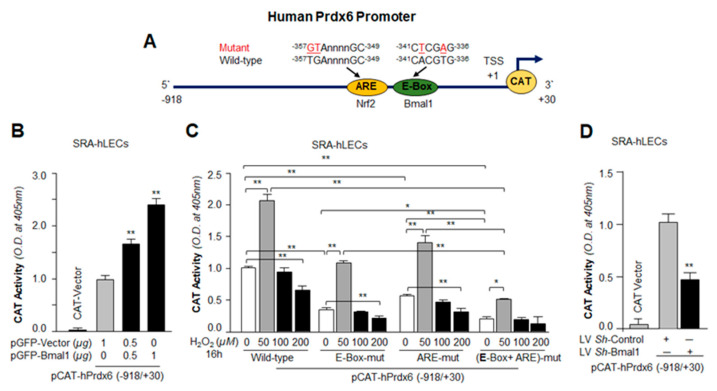
Figure 6.
Transactivation assay revealed that Bmal1 and Nrf2 cooperatively regulated Prdx6 transcription in hLECs. (A) Diagrammatic sketch of the 5′-constructs of human Prdx6 promoter (−918/+30 bps) fused to CAT reporter gene having Bmal1/E-Box and Nrf2/ARE sites location and sequence. E-Box and ARE elements sites were mutated by Site-directed mutagenesis (SDM), mutant at E-Box elements (A to T and T to A, marked in red) and mutant at ARE (TG to GT, marked in red). (B) Cells overexpressing Bmal1 showed enhanced Prdx6 transcription. SRA-hLECs were transfected with human Prdx6 promoter (−918/+30) along with different concentrations of pGFP-Bmal1 plasmids. 72 h later promoter activity was monitored. All histograms are presented as mean ± S.D. values derived from three independent experiments. **p < 0.001 vs. vector. (C) Mutagenesis and transactivation assays showed that both Bmal1 and Nrf2 were essential to boost Prdx6 transcription. SRA-hLECs were transfected with wild type (WT) hPrdx6 promoter (−918/+30) or its mutant promoter at E-Box (E-Box-mut) or at ARE (ARE-mut) or at both E-Box and ARE (E-Box-mut + ARE-mut) sites as indicated. Seventy-two hours later, transfectants were untreated or treated with different concentrations of H2O2 (50, 100, and 200 µM) for 16 h, as shown, and Prdx6 promoter activity was measured. All histograms are presented as mean ± S.D. values derived from three independent experiments. *p < 0.05; **p < 0.001. (D) Bmal1-depleted cells showed a dramatic reduction in Prdx6 transcription. SRA-hLECs were transiently infected either with GFP-linked LV Sh-Control or GFP-linked LV Sh-Bmal1, as described in Materials and Methods. Bmal1-depleted SRA-hLECs were transiently transfected with human Prdx6 promoter fused to CAT (−918/+30). Seventy-two hours after transfection, cell lysates were prepared and processed for CAT ELISA (Enzyme-linked immunosorbent assay) assay to measure Prdx6 promoter activity. All histograms are presented as mean ± S.D. values derived from three independent experiments. LV Sh-Control vs. LV Sh-Bmal1, **p < 0.001.

