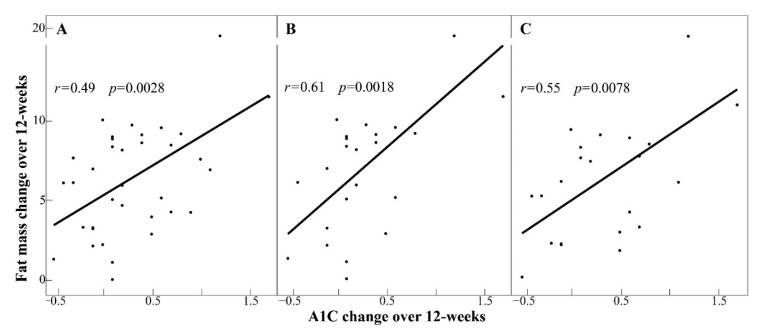
Figure 2.
Changes in fat mass and glycated hemoglobin associated in participants with higher BMI and android:gynoid fat. Scatter plots with regression line showing decrease from baseline to Week 12 (r, Pearson’s coefficient): (A) all participants; (B) higher body mass index group (HIBMI); and (C) higher android:gynoid fat group (HIAG). The corresponding low groups for BMI and AG did not show similar association.

