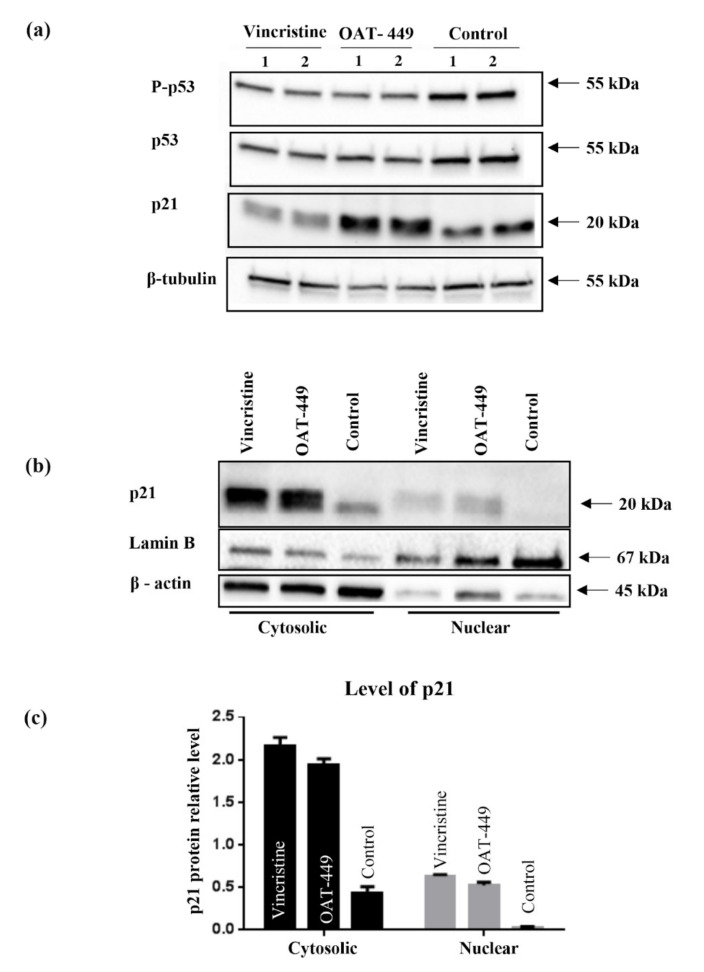
Figure 9.
Correlation of p21 and p53 proteins expression level and their distribution between cytosolic and nuclear fractions after treatment with 30 nM OAT-449 or vincristine. (a) Immunoblot of p53/P-p53 (Ser15) and p21 proteins using whole cell lysate of HT-29 cells in basal condition and upon treatment with 30 nM OAT-449 or vincristine. (Lanes 1–2 represent biological replicates for each experimental condition). (b) Immunoblot of p21 protein in the cytoplasmic and nuclear fraction of HT-29 cells in basal condition and after 18 h treatment with 30 nM OAT-449 or vincristine. Lamin B and β-actin were used as a loading control for nuclear and cytoplasmic proteins. (c) Graph represents summary of densitometry of at least 3 independent western blot analyses (mean ± SD).

