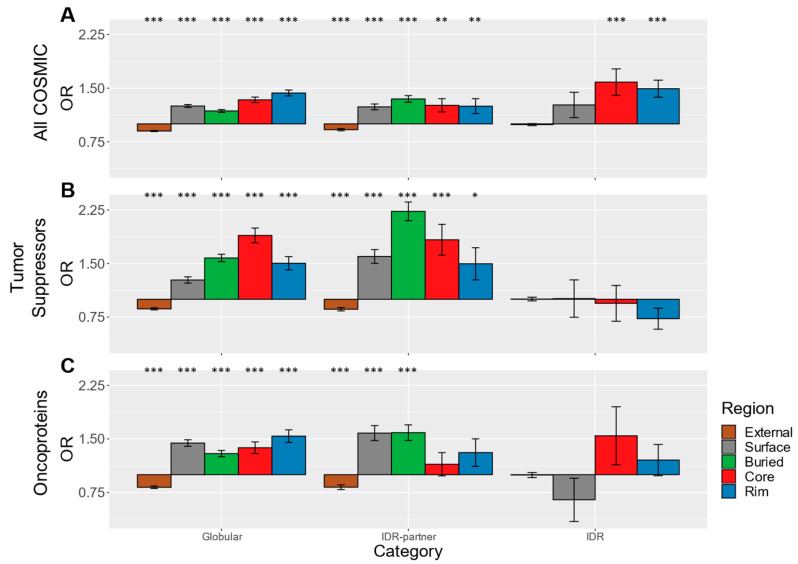
Figure 3.
Odds ratios of COSMIC SNVs. (A) A bar graph of odds ratios of all COSMIC SNVs. The odds ratios of the subsets of proteins that were categorized as (B) tumor suppressors and (C) oncoproteins, respectively. See Figure 2 for details. p-values for all odds ratios can be found in Supplementary Table S2.

