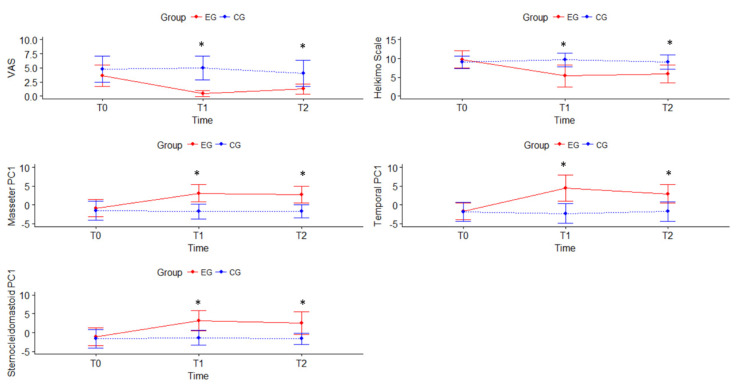
Figure 2.
Results of Visual Analogue Scale, Helkimo, and Algometry for Experimental Group (EG) and Control Group (CG). T0 = baseline measurement; T1 = post-treatment measurement; T2 = 1-month follow-up measurement. Algometry shows the Principal Component Analysis (PCA) combining in one variable both sides (left and right) of masseter muscle (MasseterPC1), of temporal muscle (TemporalPC1) and sternocleidomastoid muscle (SternoceidomastoidPC1). * significant differences (p < 0.05) between groups.

