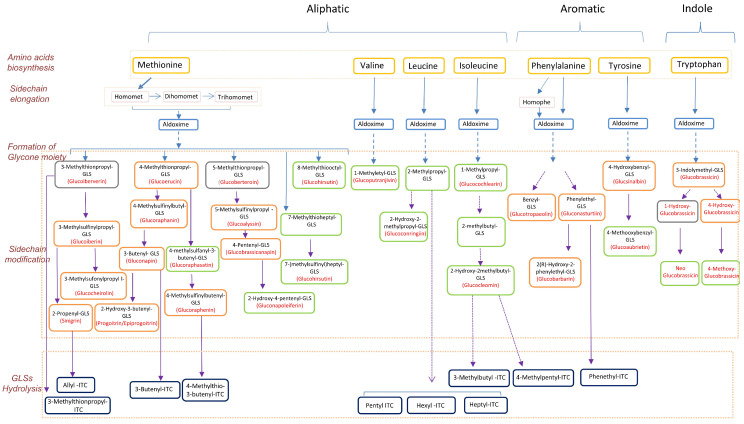
Figure 3.
Chart of pathways involving the relevant amino acids, glucosinolates, and isothiocyanates in the 12 vegetables studied. The solid arrow represents the direct step from the upstream metabolites to downstream metabolites, and the dashed arrow represents multiple steps from the upstream to downstream metabolites. Glucosinolates in orange box are quantified with pure standards, glucosinolates in green box are identified by comparison with MS/MS features in the database METLIN (http://metlin.scripps.edu/), and glucosinolates in grey box are not detected in this study. GLS: glucosinolate, ITC: isothiocyanate.

