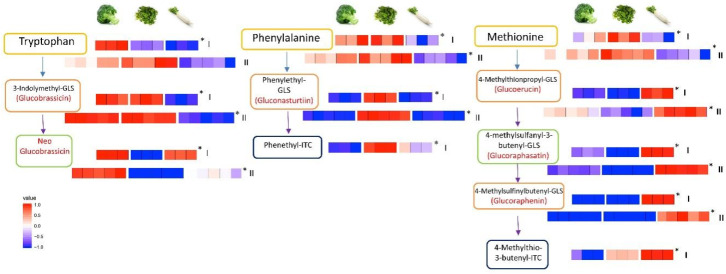
Figure 4.
Representative pathway behavior in three vegetables. A heat map of abundances of metabolites detected involved in the pathways from amino acids to glucosinolates and isothiocyanates in three different vegetables which grow in different environments (aboveground broccoli, damp soil or submerged watercress and belowground radish). The data was collected using an untargeted approach and the presented heat maps depict the discovery set of three samples and validation data consisting of 5 samples. The isothiocyanates could not all be included in the validation dataset. The intensities of metabolites in the heat map were expressed as relative levels in broccoli, radish and watercress. Asterisks denote statistical significance by Student’s t-test (p < 0.05). ITC: isothiocyanate.

