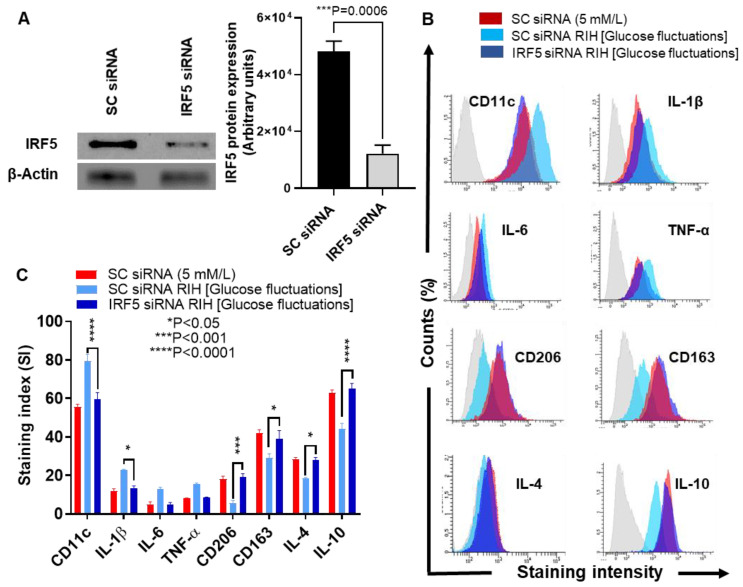
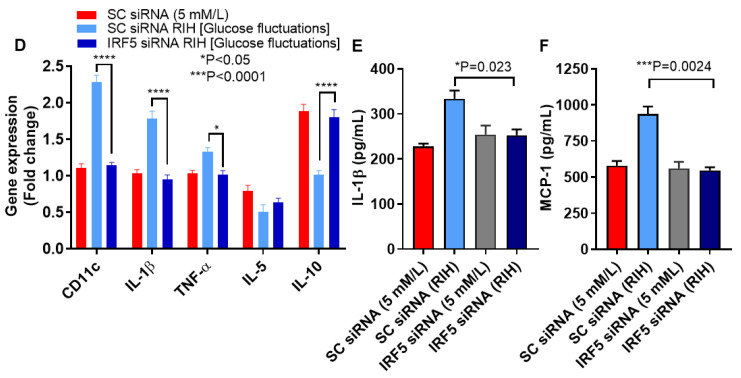
Figure 3.
IRF5 silencing prevents the expression of M1 markers and inflammatory cytokines/chemokine in THP-1 macrophages cultured under repetitive intermittent hyperglycemia (RIH). THP-1 monocytes were transfected with scrambled siRNA (mock/negative control) or IRF5 siRNA and incubated for 36 h for transformation into macrophages following standard protocol. THP-1 macrophages were then cultured for 36 h under conditions of normoglycemia (5 mM/L) and RIH/glucose fluctuations (3–15 mM/L). Cells were harvested and stained with fluorescent antibodies against M1/M2 macrophage markers and selected pro-inflammatory and anti-inflammatory cytokines as described in the Materials and Methods section. IRF5 protein expression in transfected cells was measured by Western blot. IL-1β and MCP-1 levels in culture supernatants were measured by ELISA. Cells were also harvested for measuring gene expression of M1/M2 polarization and inflammatory markers using real-time qRT-PCR as described in the Materials and Methods section. (A) Representative data from three independent determinations with similar results show the diminished IRF5 protein expression in transfected cells compared with the mock cells (p = 0.0006). (B) Representative flow cytometry data from three independent determinations with similar results are presented as histograms. (C) Representative flow cytometry data from three independent determinations with similar results are presented as bar graphs of protein expression, shown as mean staining index (SI). (D) Representative qRT-PCR data from three independent determinations with similar results are presented as bar graphs showing selected gene expression as fold change over control gene expression taken as 1. (E,F) Representative ELISA data from three independent determinations with similar results are presented as bar graphs showing secreted protein levels of IL-1β and MCP-1, respectively, in macrophage culture supernatants. All data are expressed as mean ± SEM values. * p ≤ 0.05, *** p ≤ 0.001, and **** p ≤ 0.0001.


