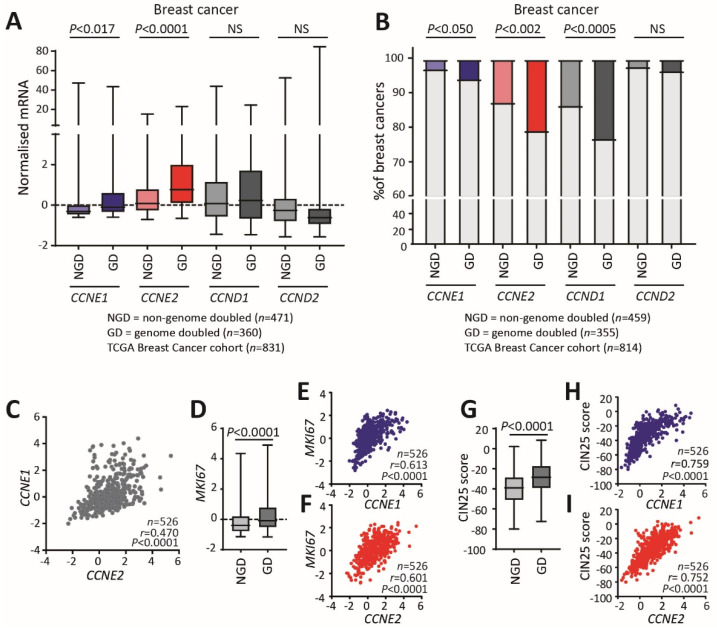
Figure 1.
Cyclin E1 and cyclin E2 are associated with whole genome doubling in breast cancer. (A) Relative CCNE1, CCNE2, CCND1, CCND2 expression was determined across the TCGA breast cancer dataset and compared between non-genome doubled (NGD) and genome doubled (GD) cancers. Data were analysed by Welch’s t-test. (B) Relative CCNE1, CCNE2, CCND1, CCND2 amplification was determined across the TCGA breast cancer dataset and compared between non-genome doubled (NGD) and genome doubled (GD) cancers. Data were analysed by Fisher’s exact test. (C) Scatter plots of CCNE1 and CCNE2 gene expression across breast cancers. Axes show log intensity level z-scores, r is Pearson co-efficient. (D) MKI67 gene expression (z-score) in NGD and GD breast cancers. Data were analysed by Welch’s t-test. E/F. Scatter plots of (E) CCNE1 versus MKI67 gene expression (z-score) and (F) CCNE1 versus MKI67 gene expression (z-score) across breast cancers, r is Pearson co-efficient. (G) CIN25 gene expression score in NGD and GD breast cancers. Data were analysed by Welch’s t-test. H/I. Scatter plots of (H) CCNE1 versus CIN25 and (I) CCNE2 versus CIN25 across breast cancers, r is Pearson co-efficient. Gene expression data were downloaded from TCGA (cBioPortal, http://cbioportal.org).

