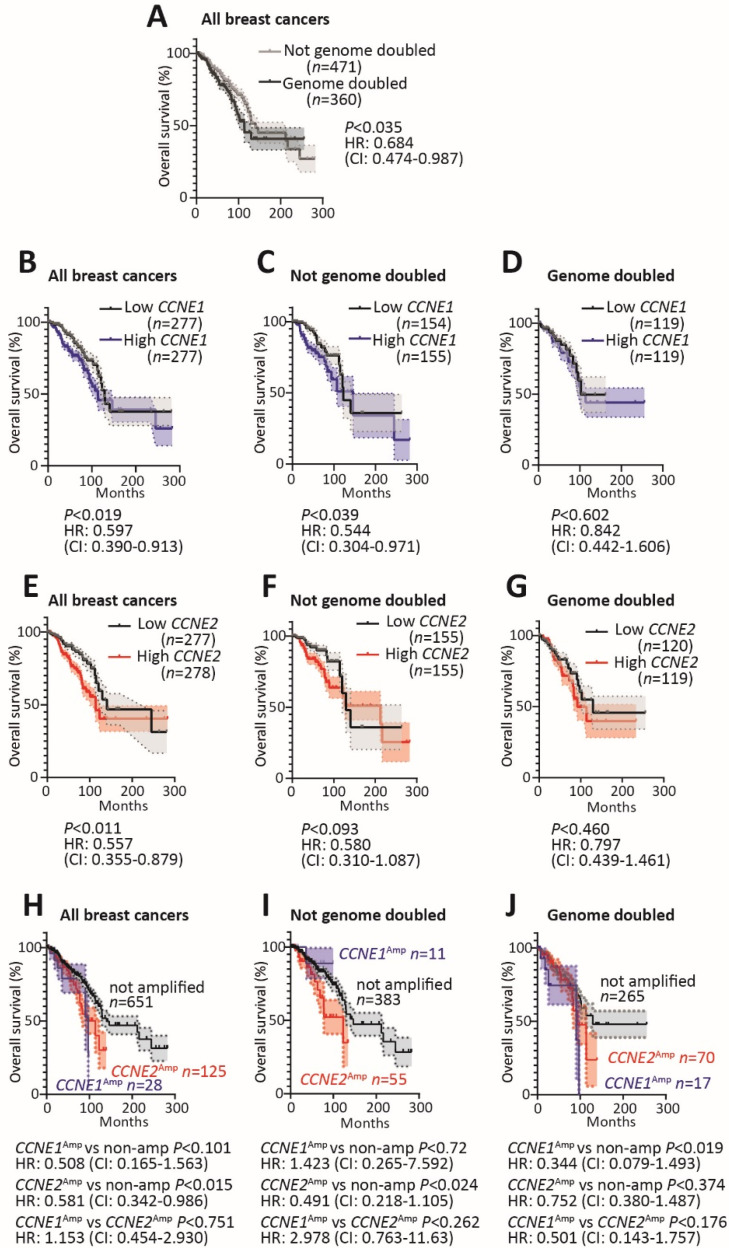
Figure 2.
Survival analysis in genome doubled and non-genome doubled cancers based on CCNE1 and CCNE2 expression and amplification. For all analyses, gene expression and amplification data and survival outcomes for breast cancer were downloaded from TCGA (cBioPortal, http://cbioportal.org). The p-values are calculated by logrank Kaplan–Meier (K–M) analyses and hazard ratios from the logrank test. (A) K–M curves show estimated survival over time associated with genome doubling in breast cancers. NGD is non-genome doubled (n = 471) and GD is genome doubled (n = 360). (B) K–M curves of estimated survival in all breast cancers associated with high CCNE1 (top tertile) and low CCNE1 (bottom tertile). (C) K–M curves of estimated survival in NGD breast cancers associated with high CCNE1 (top tertile) and low CCNE1 (bottom tertile). (D) K–M curves of estimated survival in GD breast cancers associated with high CCNE1 (top tertile) and low CCNE1 (bottom tertile). (E) K–M curves of estimated survival in all breast cancers associated with high CCNE2 (top tertile) and low CCNE2 (bottom tertile). (F) K–M curves of estimated survival in NGD breast cancers associated with high CCNE2 (top tertile) and low CCNE2 (bottom tertile). (G) K–M curves of estimated survival in GD breast cancers associated with high CCNE2 (top tertile) and low CCNE2 (bottom tertile). (H) K–M curves of estimated survival associated with CCNE1 amplification (n = 28), CCNE2 amplification (n = 125) and cancers without amplification of CCNE1/CCNE2 (n = 651). (I) K–M curves of estimated survival in NGD breast cancers associated with CCNE1 amplification (n = 11), CCNE2 amplification (n = 55) and cancers without amplification of CCNE1/CCNE2 (n = 383). (J) K–M curves of estimated survival in GD breast cancers associated with CCNE1 amplification (n = 17), CCNE2 amplification (n = 70) and cancers without amplification of CCNE1/CCNE2 (n = 265).

