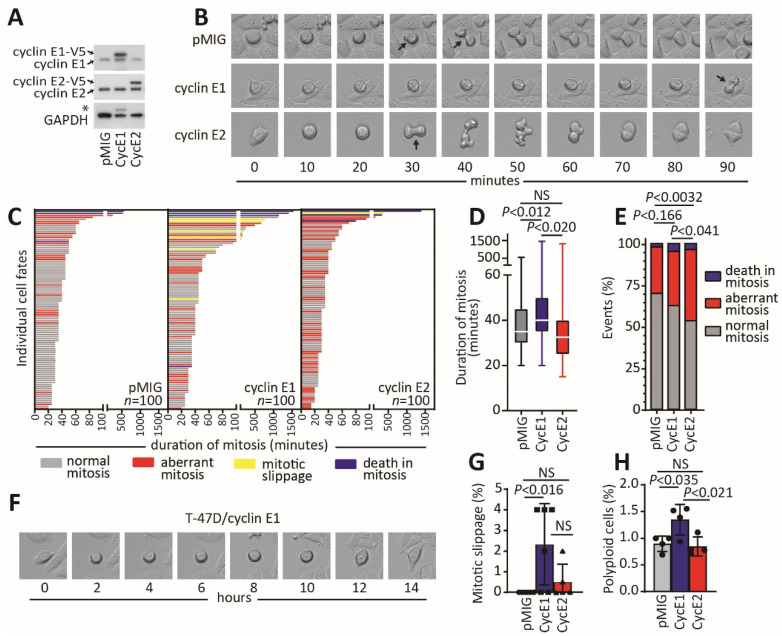
Figure 3.
Overexpression of cyclin E2, but not cyclin E1, promotes aberrant mitosis without mitotic slippage. (A) T-47D cells constitutively overexpressing cyclin E1, cyclin E2 or pMIG vector were western blotted to confirm overexpression. The uncropped western blot figure in Figure S4. * Indicates cyclin E1 band in the GAPDH blot reprobed from the same membrane. (B) Live cell imaging was used to monitor progression of cells for 72 h through the cell cycle, representative examples of T-47D pMIG, T-47D cyclin E1 and T-47D cyclin E2 shown. Arrows indicate anaphase. (C) Quantitation of mitoses of 100 cells per cell line. Grey are normal mitoses, red are aberrant mitoses (multipolar, asymmetrical divisions, multiple attempts at mitosis), yellow are mitotic slippages, blue are death in mitosis. D/E. Live cell imaging was scored over four fields of view in duplicate experiments for each cell line. (D) shows that the duration from nuclear envelope breakdown to anaphase. Data were analysed by one-way ANOVA, with Tukey’s multiple comparisons test. (E) The number of normal mitoses, aberrant mitoses and deaths in mitosis. Data were analysed by chi-squared test; NS is not significant. (F) Example of T-47D-cyclin E1 cell undergoing mitotic slippage. (G) Quantitation of mitotic slippage in each cell line scored over four fields of view in duplicate experiments. Data were analysed by one-way ANOVA, with Tukey’s multiple comparisons test; NS is not significant. (H) Quantitation of polyploid cells by flow cytometry of propidium iodide-stained cells gated for >4N content. Data were analysed by one-way ANOVA, with Tukey’s multiple comparisons test; NS is not significant.

