Figure 3.
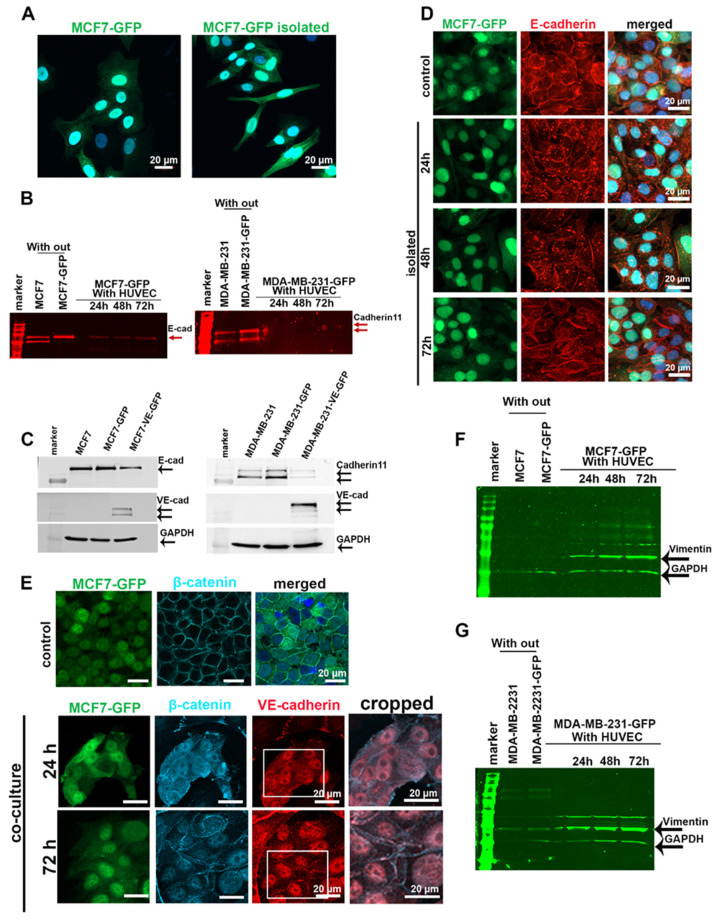
Endogenous cadherins in MCF7 and MDA-MB-231 cells were downregulated after co-culturing with HUVECs. (A) After having been co-cultured with HUVECs for 5 days, MCF7-GFP cells exhibited an elongated cell shape, resembling a more mesenchymal phenotype. (B) MCF7-GFP and MDA-MB-231-GFP cells co-cultured with HUVECs over different time points (24, 48, and 72 h) were isolated by FACS and lysed to quantify the expression level of E-cadherin in MCF7 and cadherin-11 in MDA-MB-231 cells by Western blotting by using a secondary antibody with a detection signal in the 700 nm channel of the Li-Cor Odyssey Infrared Reading System. Bands are shown in red. The GAPDH loading controls are shown in (F,G), which are the same Western blot membranes. (C) Forced expression of VE-cadherin-GFP in MCF7 and MDA-MB-231 cells induced downregulation of endogenous cadherin. Monocultured MCF7 and MDA-MB-231 cells, either non-transduced or transduced to express VE-cadherin, were lysed and analyzed for their endogenous cadherins. An equal concentration of samples (50 µg) were loaded onto polyacrylamide gels. (D) After having been co-cultured with HUVECs for 5 days, MCF7-GFP cells were isolated by FACS and further monocultured for 24, 48, and 72 h. Even 48 h after cancer cell isolation, immunofluorescent staining showed that E-cadherin (red) is internalized and degraded (red). (E) Immunofluorescent staining of β-catenin in control (MCF7-GFP monoculture) and in MCF7-GFP cells that were co-cultured with HUVECs revealed an overall but transient displacement of β-catenin from intercellular cell contacts. (F,G) Western blot analysis of vimentin expression levels in MCF7-GFP cells (F) and MDA-MB-231-GFP cells (G) after isolation from co-culture showed that MCF7 cells, and to a less extent also MDA-231 cells, increased their vimentin expression during coculture with HUVECs. To this end, the same Western blot membranes of (B) were stained for vimentin and GAPDH using corresponding secondary antibodies with an emission signal in the 800 nm channel of Li-Cor Odyssey Infrared Reading System. The bands are hued in green. Western blots of (B,C,F) are shown in Figure S9.

