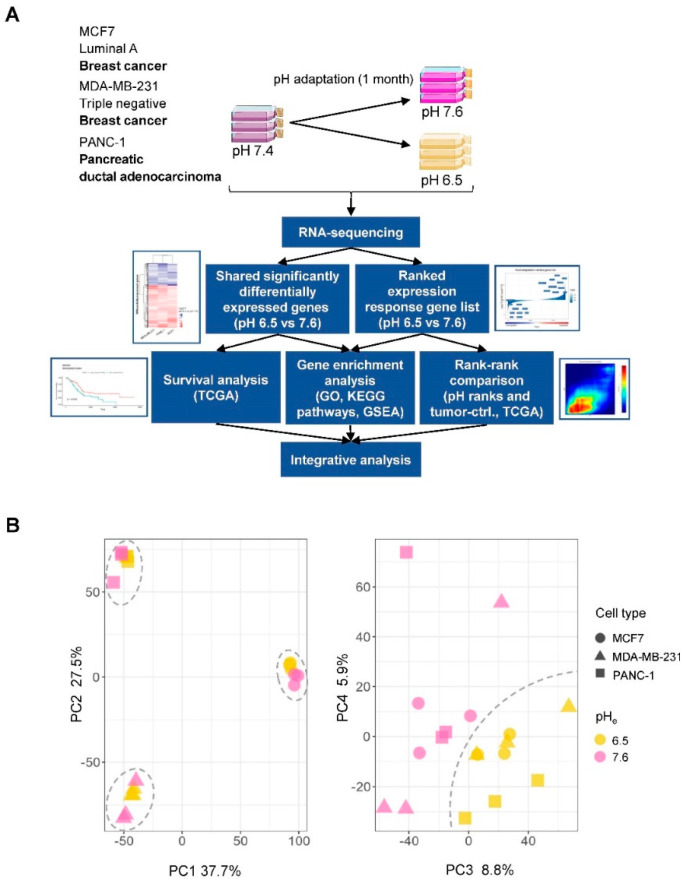
Figure 1.
Overview of study procedures and analyses. (A) Overview of the experimental design, and individual and integrative analyses performed. Three cancer cell lines in triplicates (MDA-MB-231, MCF7 and PANC-1) were acid-adapted to pH 6.5 and 7.6 over a period of 1 month and subjected to RNA-sequencing analysis (RNA-seq). Below this, an overview of computational analyses performed is shown. Briefly, we used two strategies to define a shared acid adaptation gene expression profile: by defining sets of statistically significant genes, or by ranking genes by their expression fold change (pH 6.5 vs. 7.6; Figure 2). These lists were then subject to over-representation analyses (Figure 2), survival analysis in multiple cancers (Figure 3), and comparison to tumor-control tissue (ctrl.) RNA-seq experiments from patient samples (Figure 4 and Figure 5), to identify a final list of genes that are up-/downregulated in acid adaptation as well as in tumor vs. ctrl. experiments, and whose in vivo expression is associated with overall patient survival (Figure 6). (B) Principle component analysis (PCA) based on gene expression. The x- and y-axes show principle components (PCs) 1 and 2 in left panel, 3 and 4 in right panel. Percentage explained variance is shown at each axis. Each dot corresponds to one RNA-seq library. Symbol shapes correspond to cell lines and color corresponds to pH treatment. In the left panel, dashed circles show three groups corresponding to cell lines. In the right panel, the dashed line divides samples by pH treatment.

