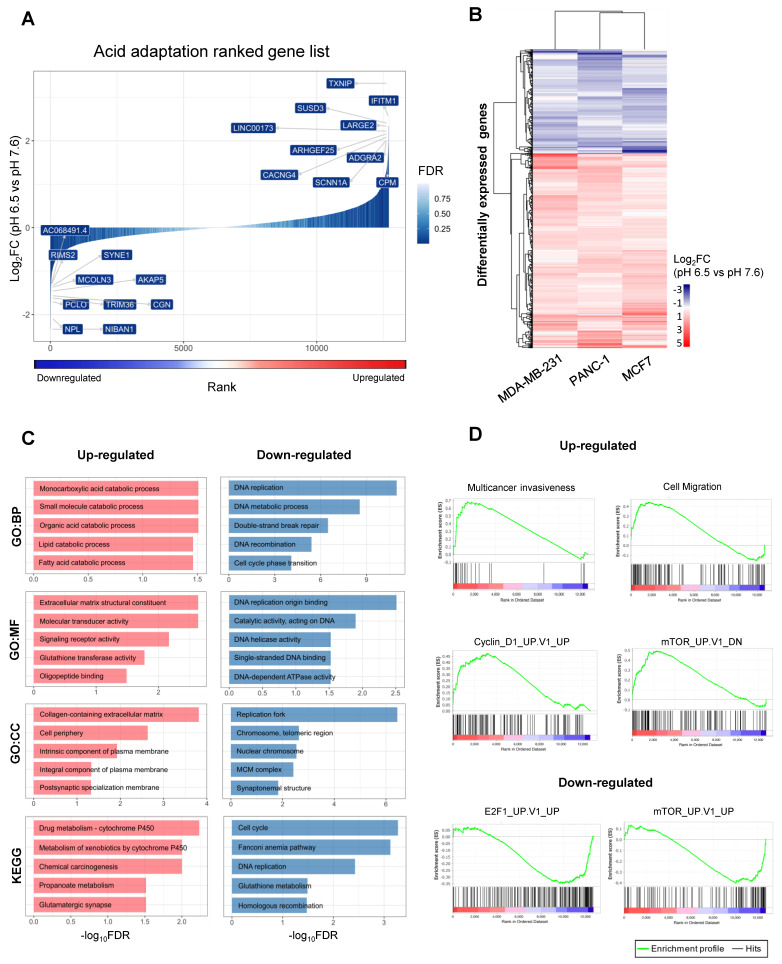
Figure 2.
Identification of a shared acid adaptation expression response. (A) Fold change-based ranking of all genes differentially expressed in chronically acid-adapted cancer cells. The x-axis corresponds to the rank assigned to each gene from 1 to N based on gene expression fold change (pH 6.5 vs. pH 7.6) in log2 scale (y-axis), also illustrated by blue–red gradient below. Bar color intensity indicates differential expression significance, expressed as false discovery rate (FDR). Genes with the largest absolute fold change are labelled on the plot. (B) Heatmap visualization of differential expression change in chronically acid-adapted cells. Rows correspond to significantly differentially expressed genes (480 upregulated and 256 downregulated), and columns correspond to three cancer cell lines (MDA-MB-231, PANC-1 and MCF7). Color indicates average log2 fold change of gene expression (pH 6.5 vs. pH 7.6) across three replicates per condition. (C) Gene Ontology (GO) term analysis of differentially expressed genes in chronically acid-adapted cells. The x-axis shows GO term enrichment FDR values in −log10 scale for differentially expressed genes defined above. The y-axis shows the top 5 GO terms from three categories (BP—Biological process, MF—Molecular function, CC—Cellular Component) and pathways from the KEGG (Kyoto Encyclopedia of Genes and Genomes) database, ordered by FDR. Bar colors correspond to up- or downregulated gene sets as in (B,D) Gene set enrichment analyses (GSEA) based on acid adaptation-ranked gene list from A to gene lists in the SigDB database. A subset of comparisons is shown as GSEA plots: the SigDB gene list identifier is shown on top of each plot. The y-axis in subplot shows the enrichment score, reflecting how much the chosen gene set is over-represented at the top or bottom of the ranked acid adaptation gene list. In the x-axis, red indicates upregulation at pH 6.5, and blue downregulation, as in Figure 2A. Vertical lines in the lower part of the plot show where in the ranked acid adaptation gene list the genes in the selected SigDB gene list occurred.

