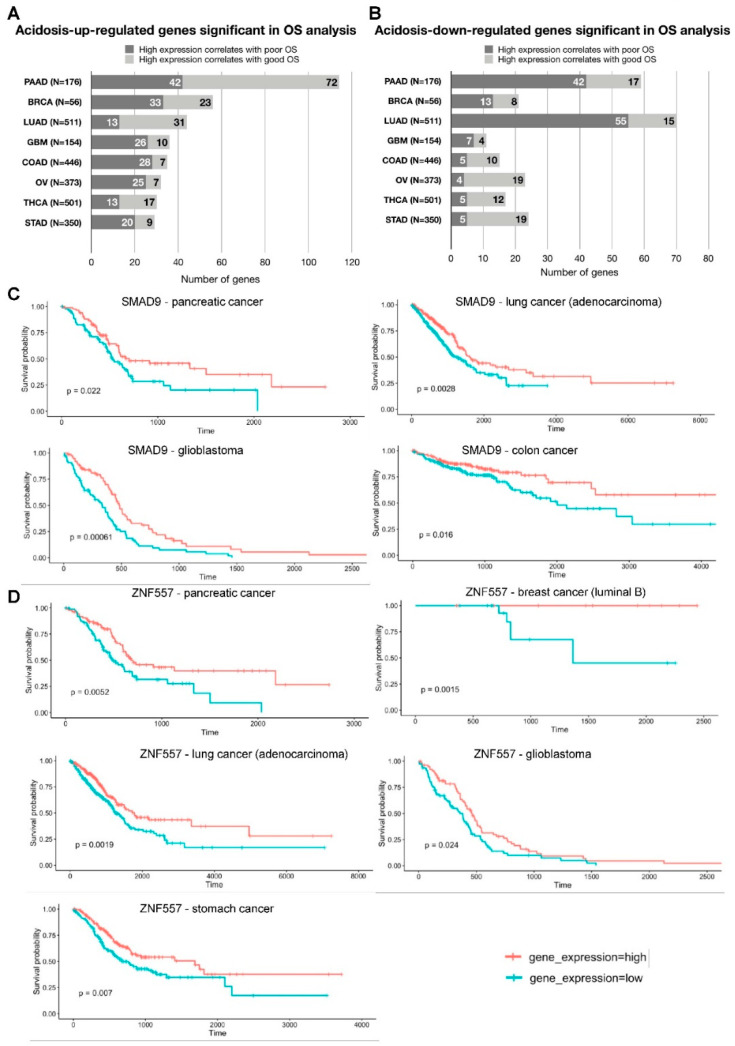
Figure 3.
Correlation of genes differentially regulated in chronically acid adaptation cancer cells with patients’ overall survival. (A) Summary of patient overall survival (OS) analysis based on acid adaptation-upregulated genes. Bars show the number of genes significantly associated with overall survival (x-axis), stratified by whether high patient gene expression correlates with poorer or better OS (indicated by bar color). The y-axis shows cancer type, where N is the number of patients analyzed. PAAD—pancreatic cancer, BRCA—breast cancer (luminal B), LUAD—lung cancer (adenocarcinoma), GBM—glioblastoma, COAD—colon cancer, OV—ovarian cancer, THCA—thyroid cancer, STAD—stomach cancer. (B) Summary of patient OS analysis based on acid adaptation-downregulated genes. Arranged as in (A,C) Survival analysis based on SMAD9 expression levels. Kaplan–Meier overall survival analysis in pancreatic cancer, lung adenocarcinoma, glioblastoma and colon cancer patients, respectively, based on SMAD9 expression levels (GDC TCGA datasets). The y-axis shows survival probability, the x-axis shows time in days. Red line: patient group with high expression of the analyzed gene. Blue line: patient group with low expression of the analyzed gene. Survival analysis p-value is shown. (D) Survival analysis based on ZNF557 expression levels. Kaplan–Meier overall survival analysis in pancreatic cancer, breast cancer (luminal B), lung adenocarcinoma, glioblastoma and stomach cancer patients respectively, based on ZNF557 expression levels, arranged as in (C).

