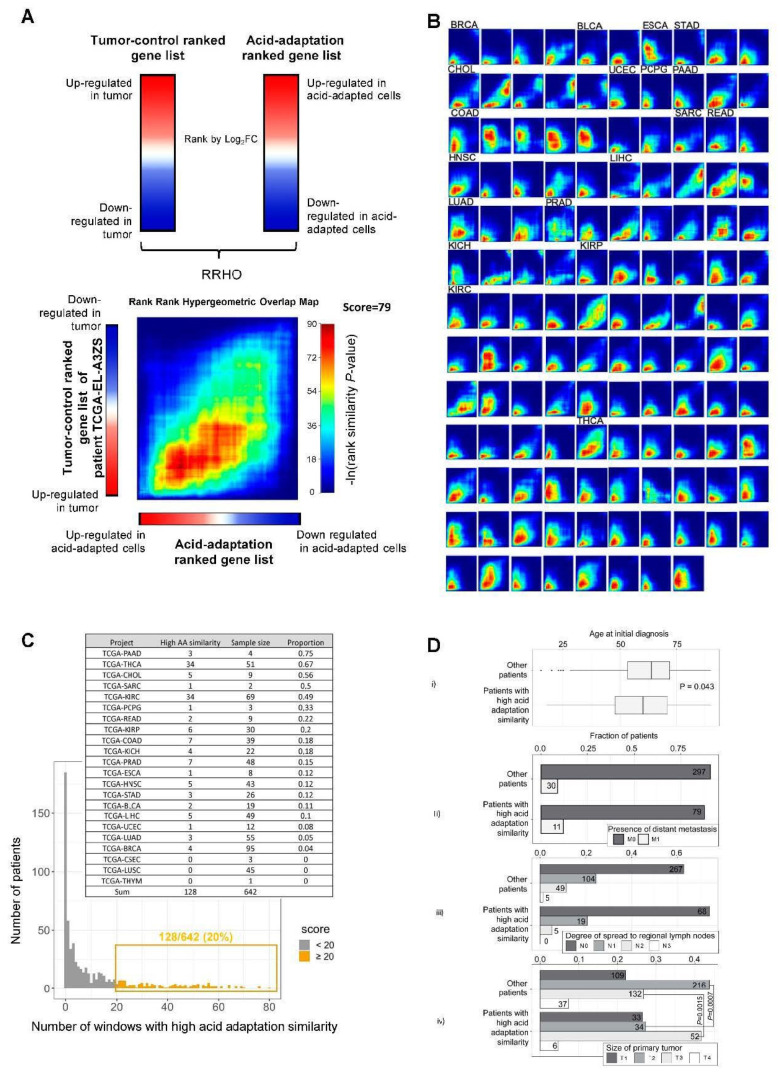
Figure 4.
Rank–rank analysis of acid adaptation and patient tumor–ctrl. ranked gene lists. (A) Conceptual overview of rank–rank hypergeometric overlap (RRHO) analysis. Genes are ranked by their log2 fold expression change based on either tumor–ctrl. comparison for a given patient (left) or by acid adaptation response (pH 6.5 vs. 7.6). These ranked gene lists are compared in the rank–rank heat map below (exemplified by the comparison of data from the TCGA patient TCGA-EL-A3ZS and the acid adaptation gene list), identifying windows of genes with correlated ranks in respective gene lists and the significance of such correlated ranks, as indicated by color (based on ln(hypergeometric p-values) as shown). (B) Heat maps resulting from patient tumor–ctrl. vs. acid adaption gene list RRHO analyses showing high gene rank similarity. Each heat map corresponds to patient tumor–ctrl. vs. acid adaptation gene list analysis as in (A), where the acid adaptation gene list is always at the x-axis and the color scale is as in (A). Cancer types are indicated on top of heat maps: consecutive heat maps to the right have the same cancer type unless otherwise indicated (BRCA—breast cancer (luminal B), BLCA—bladder urothelial carcinoma, ESCA—esophageal carcinoma, STAD—stomach cancer, CHOL—cholangiocarcinoma, UCEC—uterine corpus endometrial carcinoma, PCPG—pheochromocytoma and paraganglioma, PAAD—pancreatic cancer, COAD—colon cancer, SARC—sarcoma, READ—renal adenocarcinoma, HNSC—head and neck squamous cell carcinoma, LIHC—liver hepatocellular carcinoma, LUAD—lung cancer (adenocarcinoma), PRAD—prostate adenocarcinoma, KICH—kidney chromophobe, KIRP—kidney renal papillary cell carcinoma, KIRC—kidney renal clear cell carcinoma, THCA—thyroid cancer). (C) Distribution of RRHO similarity scores across TCGA patients. The y-axis shows the number of patients with a given RRHO similarity score (x-axis) calculated as the fraction of windows with a p < 0.05 in rank–rank heat maps (out of a total of 100 windows). Analyses resulting in >20 windows with p < 0.05 (highlighted in yellow) were considered “high acid adaptation similarity”. The number of analyzed patients and the number of analyses resulting in high acid adaptation similarity scores are shown as an insert table. (D) Relation between high acid adaptation similarity score and patient metadata. Subpanel i shows the distribution of age of diagnosis split by whether patients are in the “high acid adaptation similarity” group, visualized as box plots. p-value is from two-sided t test. Subpanel ii–iv shows fraction of patients classified by TNM staging system. T: size of the primary tumor. T1, T2, T3, T4—size and/or extension of the primary tumor. N: degree of spread to regional lymph nodes. N0—no regional lymph nodes metastasis; N1—regional lymph node metastasis present (at some sites, tumor spread to closest or small number of regional lymph nodes); N2 —tumor spreads to an extent between N1 and N3; N3—tumor spread to more distant or numerous regional lymph nodes. M: presence of distant metastasis. M0—no distant metastasis; M1—metastasis to distant organs (beyond regional lymph nodes). Bars are split by whether patients are in the “high acid adaptation similarity” group. p-values from Fisher exact tests are shown, testing the decrease in T1 and increase in T2 in the “high acid adaptation similarity” group vs. remaining patients. Numbers on bars show patient counts.

