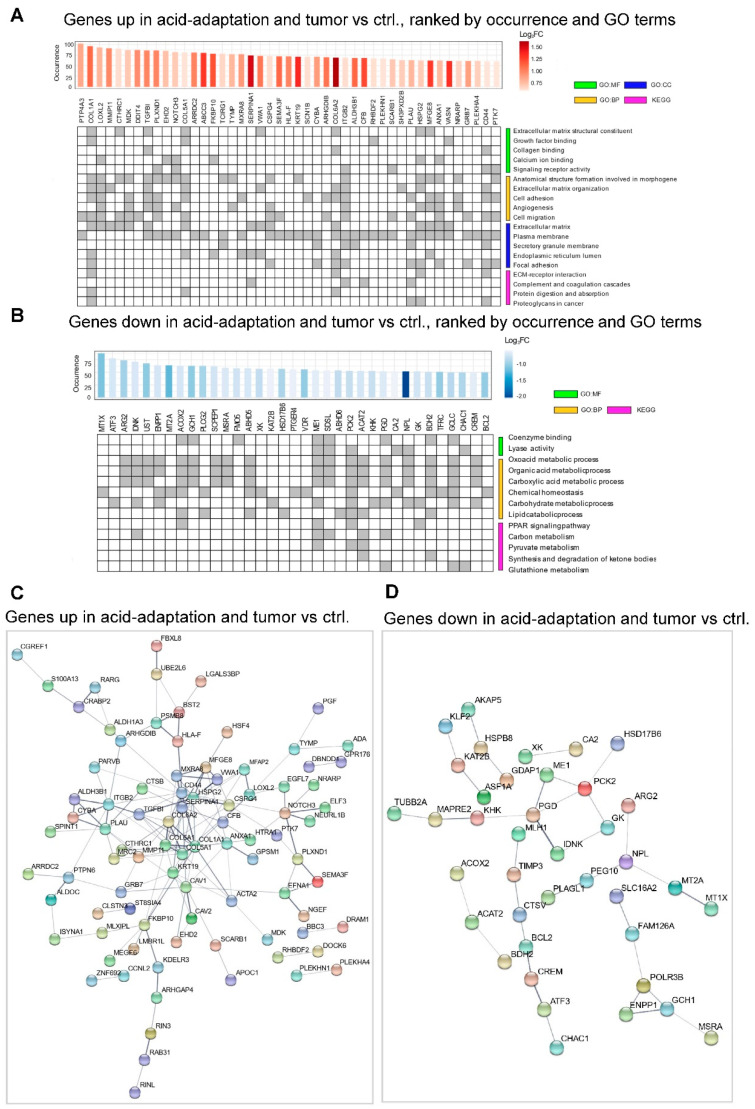
Figure 5.
Analysis of overlapping genes between pH ranks and tumor–ctrl. ranks with high similarity. (A) Gene ontology (GO) and KEGG pathway analysis of genes upregulated in acid adaptation and correlated in gene expression rank in tumor–ctrl. comparisons in ≥50 patients. The upper bar plot shows the number of tumor–ctrl. vs. acid adaptation RRHO analyses in which the gene was identified as significant. Bar color indicates log2 expression FC in the acid adaptation experiment (pH 6.5 vs. 7.6). Gene identifiers are shown below. Rows in the bottom panel correspond to selected GO terms with high significance from three sources (BP—Biological process, MF—Molecular function, CC—Cellular Component) and pathways from the KEGG database. Columns are genes as indicated above. Grey cells indicate that a given gene is labelled with a given GO term or pathway. (B) Gene ontology (GO) analysis of genes downregulated in acid adaptation correlated in gene expression rank in tumor–ctrl. comparisons in ≥50 patients, arranged as in (A). (C) STRING database analysis of genes from panel (A). Nodes are genes. Connections indicate STRING database evidence of protein interaction. Fully unconnected genes are not shown. (D) STRING database analysis of genes from panel (B), arranged as in (C).

