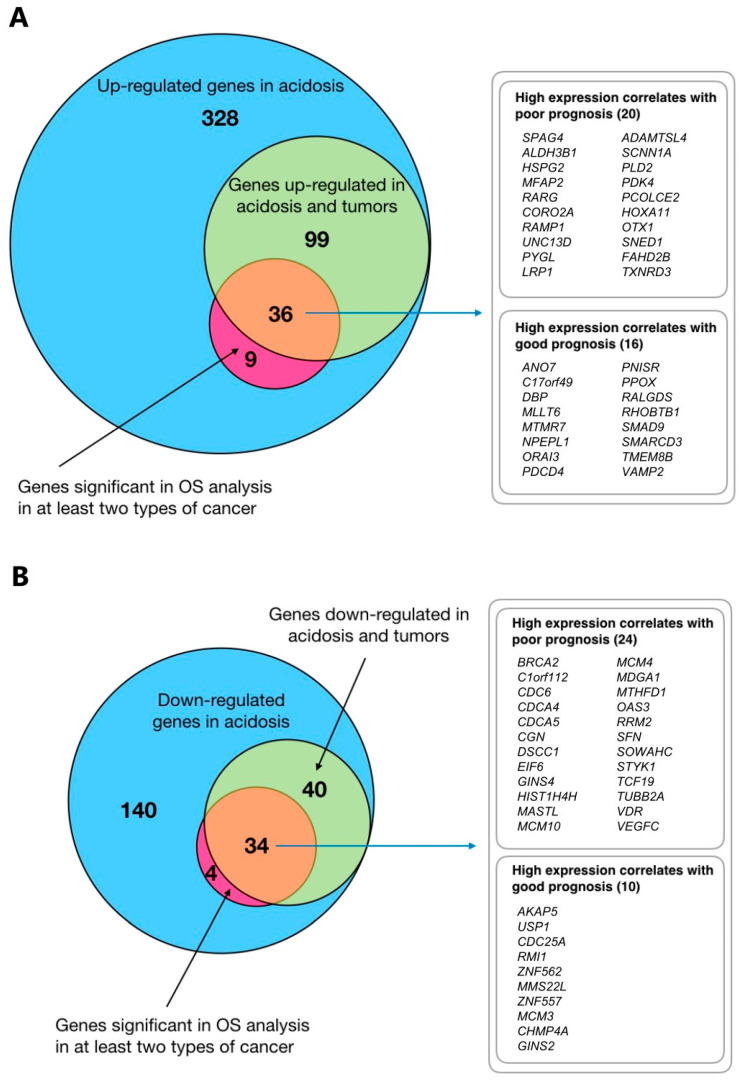
Figure 6.
Integrative analysis. (A) Overlaps between upregulated genes, OS and RRHO analyses. Venn diagrams show overlaps between acid adaptation-upregulated genes (from Figure 2B), of genes significant in overall survival (OS) analysis in at least two types of cancer (based on TCGA data, Figure 4), and genes identified as having significant rank correlations between acid adaptation and tumor-control gene rank lists (RRHO analysis, Figure 4 and Figure 5). (B) Overlaps between downregulated genes, OS and RRHO analyses Venn diagrams arranged as in (A) but focused on acid adaptation-downregulated genes.

