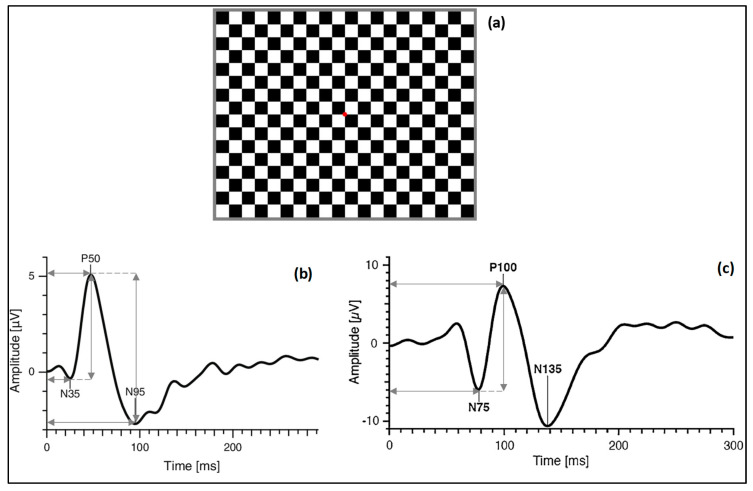
Figure 1.
(a) Checkerboard pattern with red fixation point; (b) typical waveform of pattern electroretinography (PERG), horizontal arrows indicate implicit time of N35, P50 and N95 (ms) and vertical arrows indicate amplitude values of P50 and N95; (c) typical waveform of visual evoked potential (VEP), horizontal arrows indicate implicit time of N75 and P100 (ms) and vertical arrow indicates amplitude of P100.

