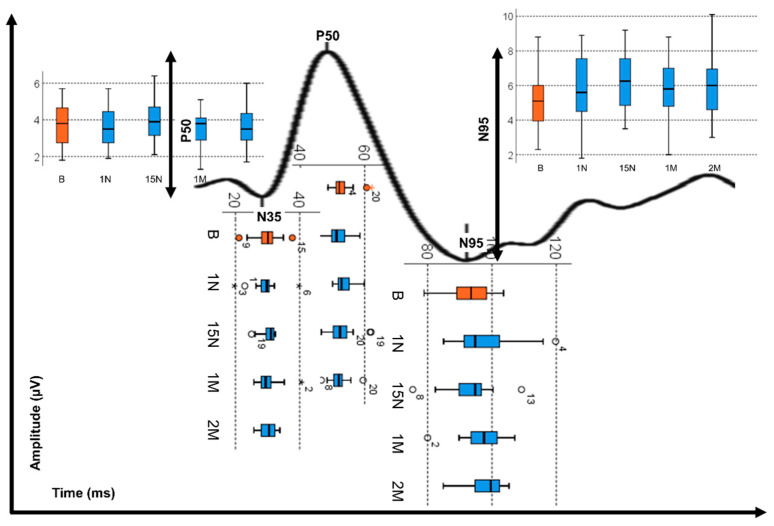
Figure 2.
Box plot presentation of the variation of the implicit peak times (N35, P50 and N95) and the variation of the peak amplitude (P50 and N95) of the PERG wave before OK treatment (B-orange) and after OK treatment (Blue: 1N—1 night, 15N—15 nights, 1M—1 month, 2M—2 months). The circles and asterisk refer to outliers found in the measurements corresponding to the number of the eye shown in the figure.

