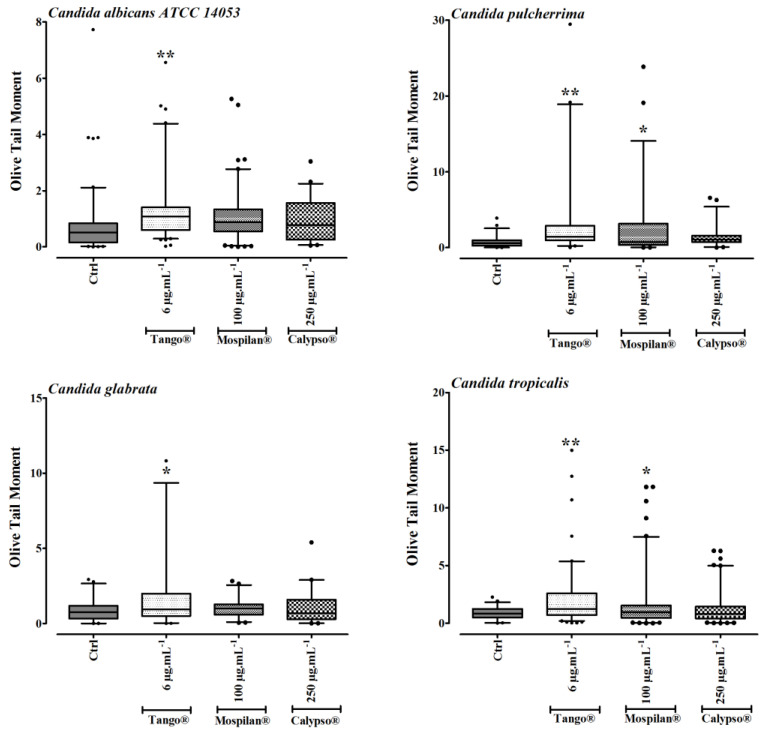
Figure 9.
Induction of DNA damage assessed with the alkaline comet assay (olive tail moment) in C. albicans ATCC 14053, C. pulcherrima, C. glabrata, C. tropicalis cells after Tango®(6 µg·mL−1), Mospilan® (100 µg·mL−1) and Calypso®(250 µg·mL−1) treatment. Bars indicate SD, n = 200, box and whisker plots are shown, ** p < 0.01, * p < 0.05 compared to control conditions (ANOVA and Dunnett’s a posteriori test). Ctrl—control conditions. Notes: Center line represents median. Lower and upper limits represent 5th and 95th percentiles, respectively. Observed values outside whiskers shown as dots.

