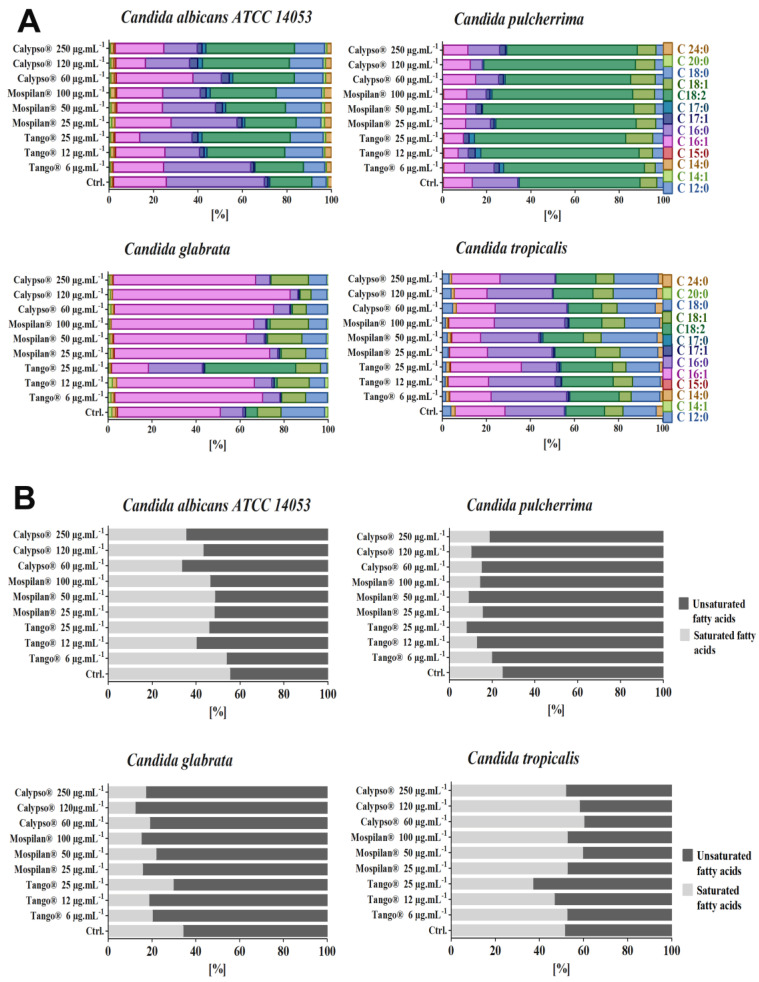
Figure 11.
(A) Fatty acid profiles and (B) unsaturated/saturated indices in Candida spp. cells after pesticide treatment. (A) Fatty acid distribution after pesticide treatment was estimated using gas chromatography with a mass detector in full scan mode. (B) The unsaturated index was calculated as the sum of FA weights multiplied by the number of unsaturated bonds for each FA in the mixture. The saturated index was calculated analogously. Percentage contents of saturated and unsaturated FAs are shown. Ctrl, control conditions; 6, 12, 25 µg·mL−1 concentration of Tango®, 25, 50, 100 µg·mL−1 concentration of Mospilan®, 60, 120, 250 µg·mL−1 concentration of Calypso®.

