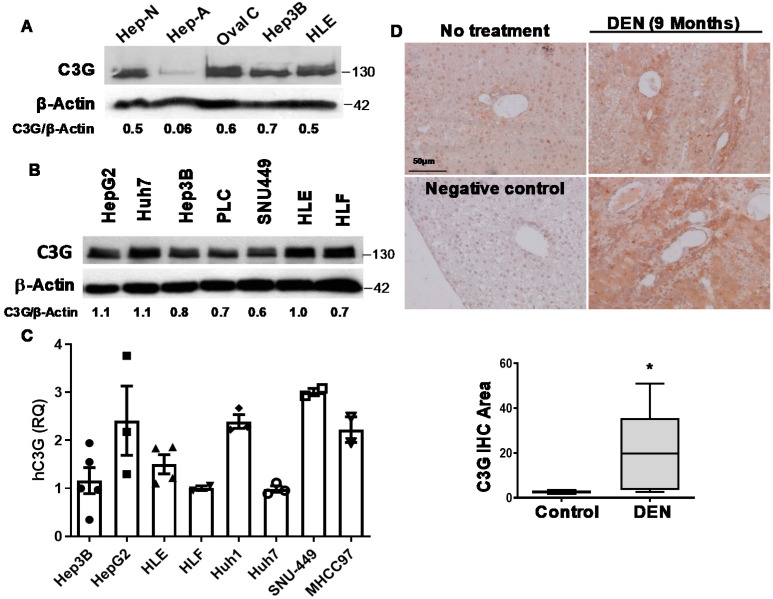
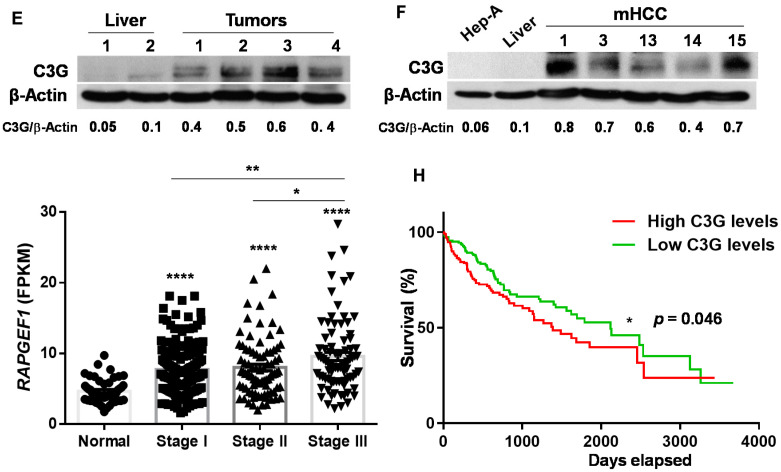
Figure 1.
C3G expression is increased in HCC. (A and B) Western-blot analysis of C3G levels normalized with β-actin: (A) in neonatal hepatocytes (Hep-N), adult hepatocytes (Hep-A), oval cells (Oval C) and HCC cell lines (Hep3B and HLE) (n = 4); and (B) in a panel of human HCC cell lines (n = 2). (C) C3G mRNA levels in human HCC cell lines determined by RT-qPCR. RQ values are relative to Hep3B cells (n = 3). (D) Upper panels: representative images of C3G levels analyzed by immunochemistry in liver sections from control (no treatment) and DEN-treated mice at 9 months after treatment; lower panel: box plot showing the mean ± S.E.M. of C3G positive areas, analyzed by ImageJ. Negative control was incubated only with a secondary antibody. * p ≤ 0.05, using Student’s t-test, control vs. DEN-treated (n = 4–7). (E,F) Western-blot analysis of C3G protein levels normalized with β-actin in: (E) control healthy liver and Alb-R26Met tumors (1, 2, 3, 4); (F) adult hepatocytes (Hep-A), control healthy liver, and HCC cells established from Alb-R26Met HCC tumors (mHCC1, 3, 13, 14, and 15) (n = 3). (G) Scatter plot with bars shows mean ± S.E.M. of C3G (RapGEF1) mRNA levels in FPKM units (fragments per kilobase of exon model per million reads mapped) in normal healthy liver samples (50) and in HCC corresponding to different stages of disease progression: stage I (176 patients), stage II (84 patients), and stage III (83 patients). * p ≤ 0.05, ** p ≤ 0.01, **** p ≤ 0.0001, analyzed by Kruskal–Wallis followed by FDR, vs. normal samples or as indicated. (H) Kaplan–Meier survival curve shows patient survival (as percentage) vs. the days elapsed of two groups of HCC patients, according to high or low C3G mRNA levels. * p ≤ 0.05, using Log-Rank Mantel–Cox survival analysis.


