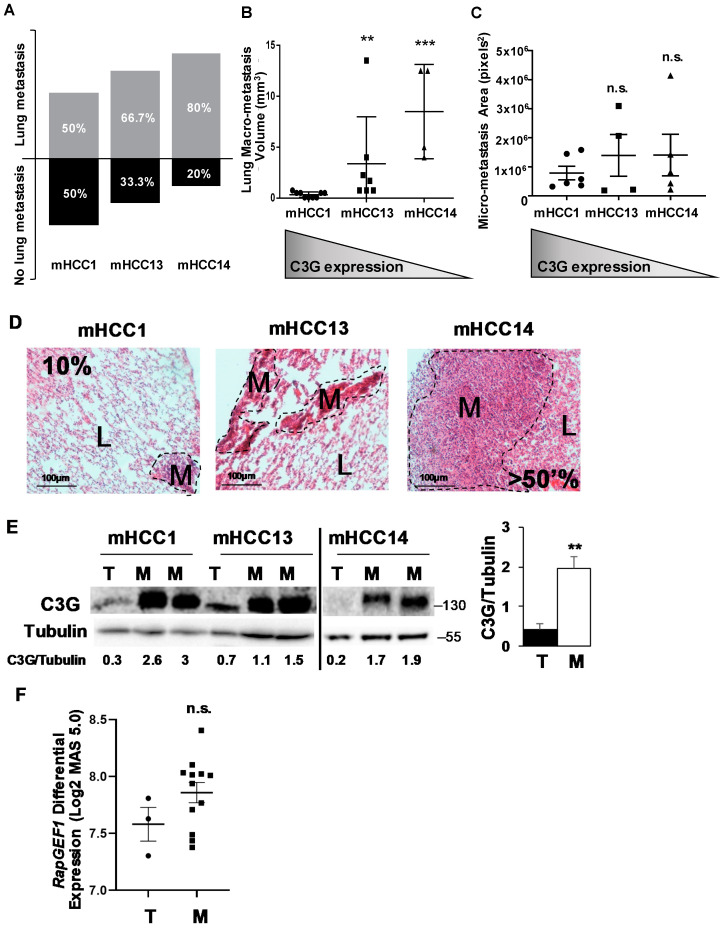
Figure 5.
C3G expression inversely correlates with the lung metastatic potential of mouse Alb-R26Met HCC cell lines. Mouse Alb-R26Met HCC cell lines (mHCC1, mHCC13, and mHCC14) were injected subcutaneously into mice flanks to generate tumors and lung metastasis. (A) Histogram showing the percentage of mice with and without lung metastasis for each mHCC cell line. (B,C) Scatter plots show the mean ± S.E.M of the volume (mm3) of lung macro-metastases for each mHCC cell line (B) or the lung micrometastasis area (pixels2) for each mHCC cell line (C), analyzed in Haematoxilin/Eosin-stained paraffin-embedded lung sections using ImageJ. Kruskal–Wallis test was used. Grey triangle shows the corresponding decreasing levels of C3G in mHCC cell lines. (D) Representative images of the Hematoxylin/Eosin stained lung (L) and metastasis (M). Dotted lines delimit metastasis area. ** p ≤ 0.01, *** p ≤ 0.001 vs. mHCC1, using Kruskal–Wallis test followed by multiple comparison, n = 2. (E) Western-blot analysis of C3G levels in tumors and lung metastasis generated by mHCC cells normalized with Tubulin. Histogram represents the mean ± S.E.M of the quantification of C3G in several tumors and metastasis (relative values). ** p ≤ 0.01, tumors vs. metastasis using Student-t test, n = 4 (F) Scatter plot represent mean ± S.E.M. of RapGEF1 mRNA differential expression levels in log2 MAS 5.0 signal of HCC primary tumors and lung metastasis from HCMDB (Human Cancer Metastasis Data Base) analyzed by Student’s t-test (p = 0.17) vs. primary tumor. n.s.: non-significant.

