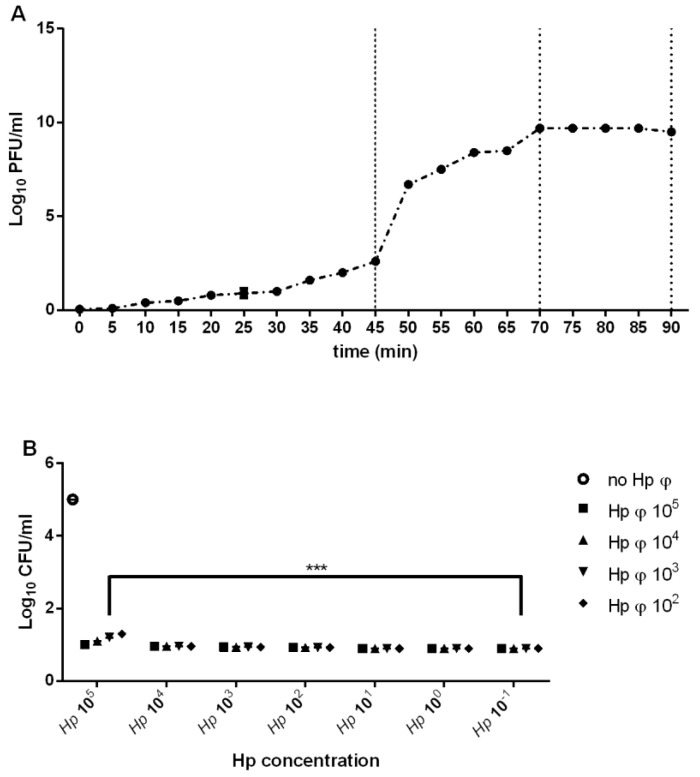
Figure 1.
Phage characterization. (A) One step growth curve of phage. (B) Representation of phage activity on Hp growth. The figure illustrates the bacterial plate counts (CFU/mL) after the activity of the phage. Each value is the mean ± SD of three independent experiments. *** p < 0.001. Statistical analysis was performed with Student’s t-test. Values are expressed as the mean ± SD from three independent experiments with three replicates for each data point.

