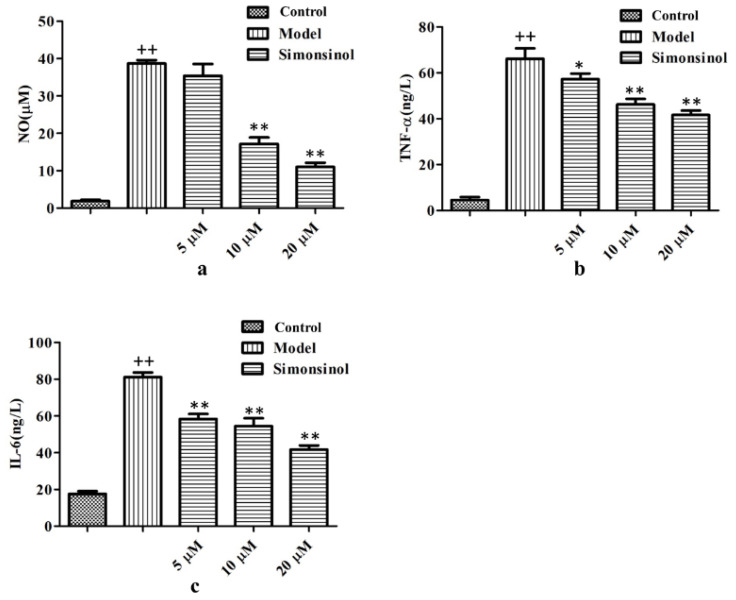
Figure 4.
Simonsinol inhibits NO (a), TNF-α (b), and IL-6 (c) secretion in LPS-stimulated RAW264.7 cells. Data are represented as the mean ± SD (n = 3). ++, highly significant difference compared to blank control cells (p < 0.01). *, significant difference compared to LPS-stimulated model cells (p < 0.05), **, highly significant difference compared to LPS-stimulated model cells (p < 0.01).

