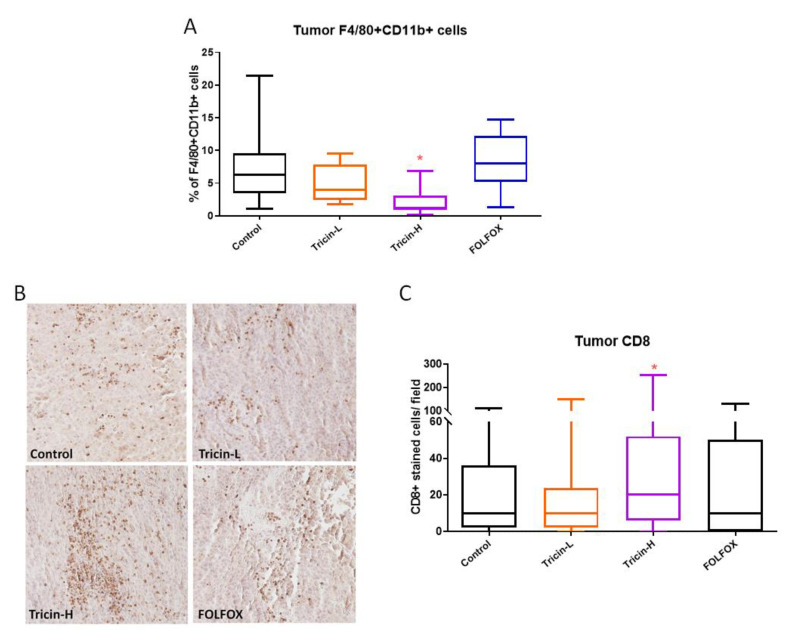
Figure 6.
Effects of tricin and FOLFOX on immune cell populations in colon tumors. Tumors were collected from different groups and divided into two halves. Cells isolated from half piece of tumor were stained with anti-F4/80 and anti-CD11b antibodies and analysed by flow cytometry for determination of macrophage population. (A) Graph showed the percentage of F4/80+ CD11b+ stained cells. Another half piece of tumor were embedded in paraffin and the tumor sections were stained with anti-CD8 antibody. (B) Representative photos showed CD8+ stained cells in dark brown color in the tumor sections. (C) Graph showed the number of CD8+ stained cells in each field. Results were expressed as box and whisker plots, n = 7–13. Differences among treatment groups were determined by one-way ANOVA followed by Tukey’s multiple comparisons test, * p < 0.05 as compared with control group.

