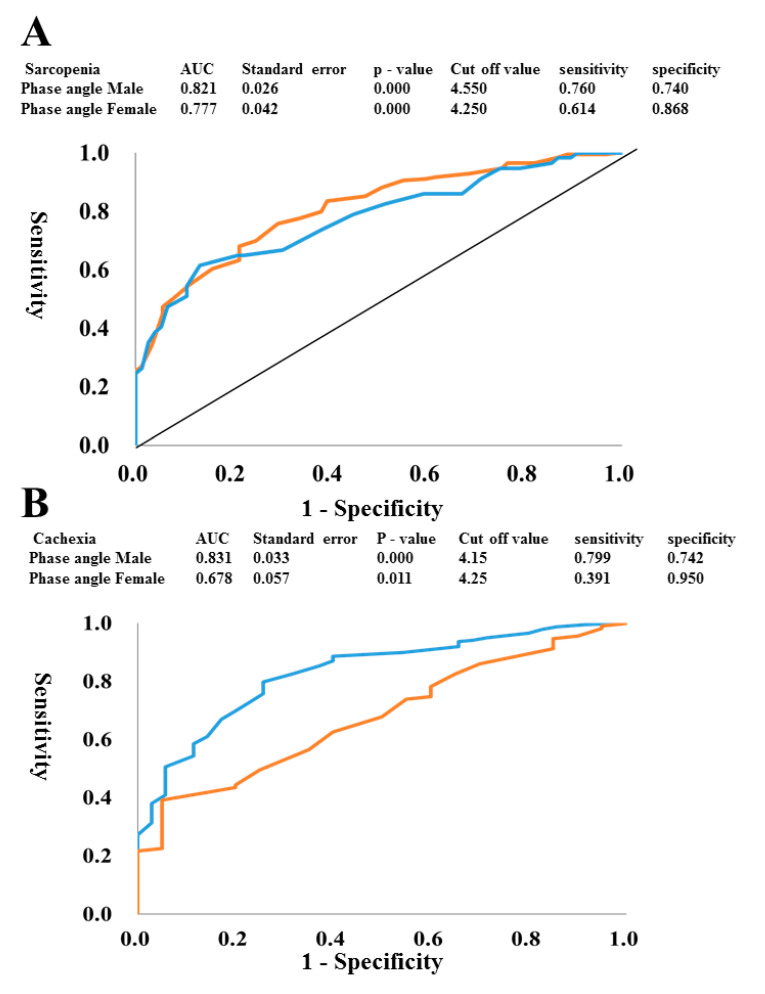
Figure 2.
ROC curves to identify the optimal phase angle cut-off for detecting sarcopenia or cachexia. To generate the ROC curves shown, different phase angle cut-offs were used to predict sarcopenia (A) and cachexia (B) with true positives plotted on the vertical axis (sensitivity) and false positives (1-specificity) plotted on the horizontal axis in both males and females. (A) red (male) blue (female) (B) blue (male) red (female).

