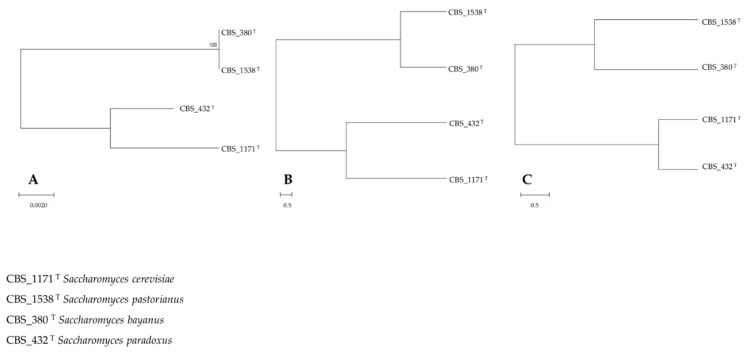
Figure 1.
Genotypic vs. phenotypic FTIR and LC-MS description of S. bayanus, S. pastorianus, S. paradoxus and S. cerevisiae reference strains. Hierarchical clustering of S. bayanus CBS 380, S. pastorianus CBS 1538, S. paradoxus CBS 432 and S. cerevisiae CBS 1171 control samples (0% ethanol). (A) Clustering obtained analyzing concatenated ITS_LSU sequences; distances were inferred with the Maximum Composite Likelihood method and expressed as number of base substitutions per site. The Neighbor-Joining method was used to reconstruct the tree. (B) Clustering obtained analyzing FTIR spectra considering the regions from 3200 to 2800 cm−1 (fatty acids) and from 1800 to 1200 cm−1 (amides and mixed region). (C) Clustering obtained analyzing LC-MS spectra using Spearman’s distance measure and Ward’s algorithm. Hierarchical clustering of phenotypes was performed.

