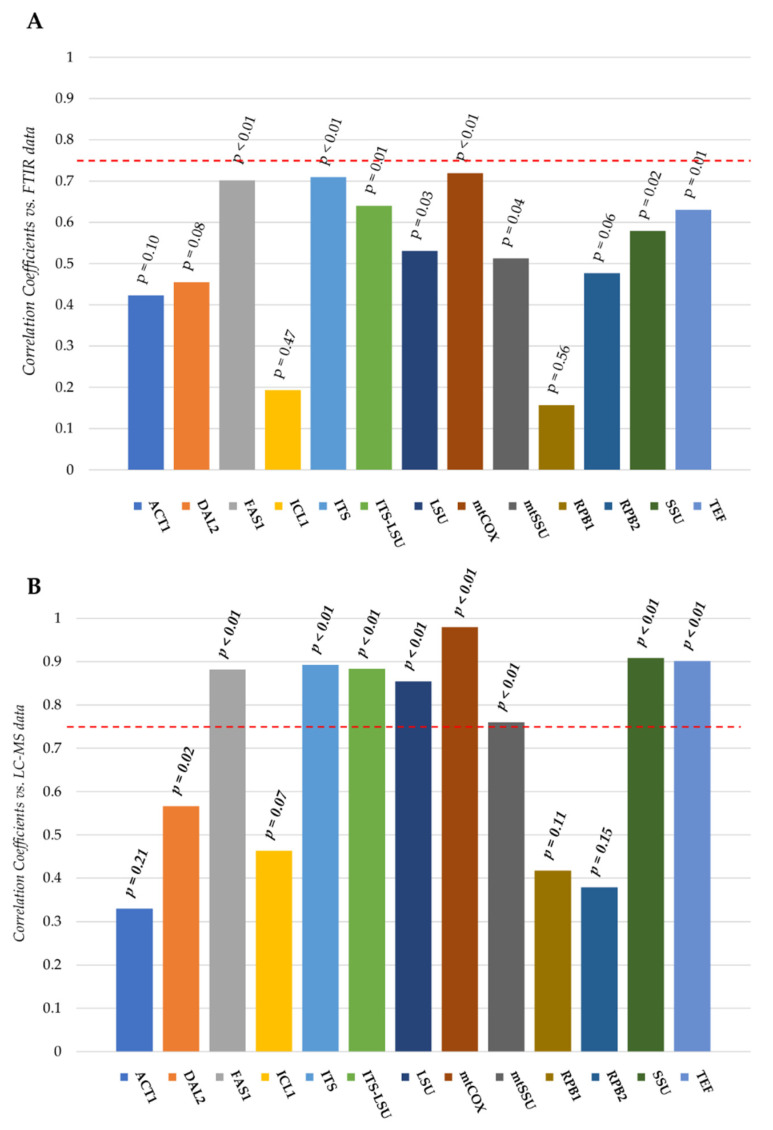
Figure 2.
Correlation between taxonomic markers and phenotypic responses of control samples of S. bayanus, S. pastorianus, S. paradoxus and S. cerevisiae reference strains. Correlation coefficients obtained from the comparison between the distance matrices calculated on the basis of each of the thirteen loci employed in the study and those obtained analyzing FTIR (A) and LC-MS (B) spectra of strains in resting condition are reported. Distances were calculated using dist and dist.dna functions included in R-Ape package (https://cran.r-project.org/web/packages/ape/index.html). Correlation analysis was carried out using cor.test function included in the R-Vegan package (https://CRAN.R-project.org/package=vegan).

