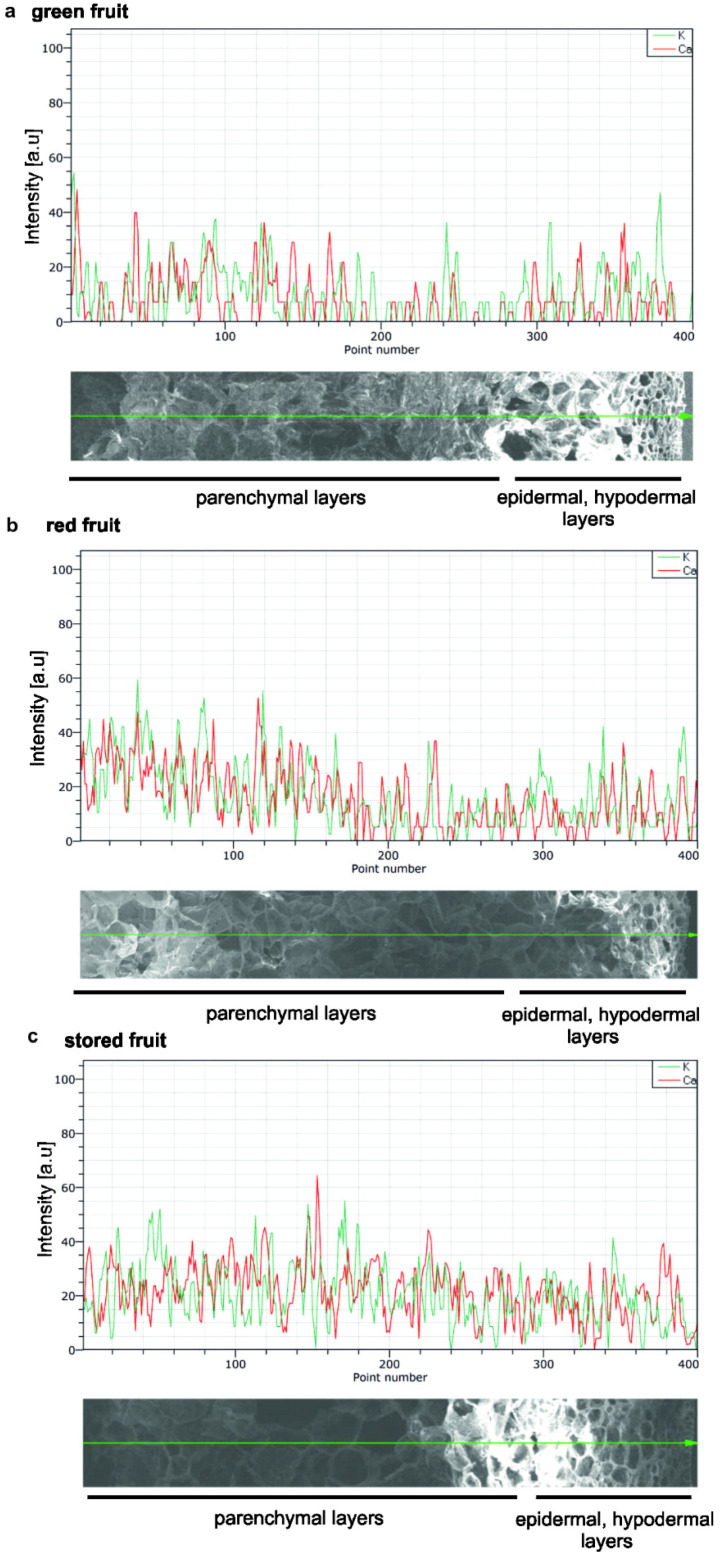
Figure 4.
Mapping of calcium and potassium ion distribution in apple fruit at different stages of ripening: green fruit (a), red fruit (b) and stored fruit (c). Studies on Ca content was detected by SEM X-ray line profiles with magnification 100 ×. Red curve, Ca intensity counts. Green curve, K intensity counts. Green line on SEM images, the scanning line.

