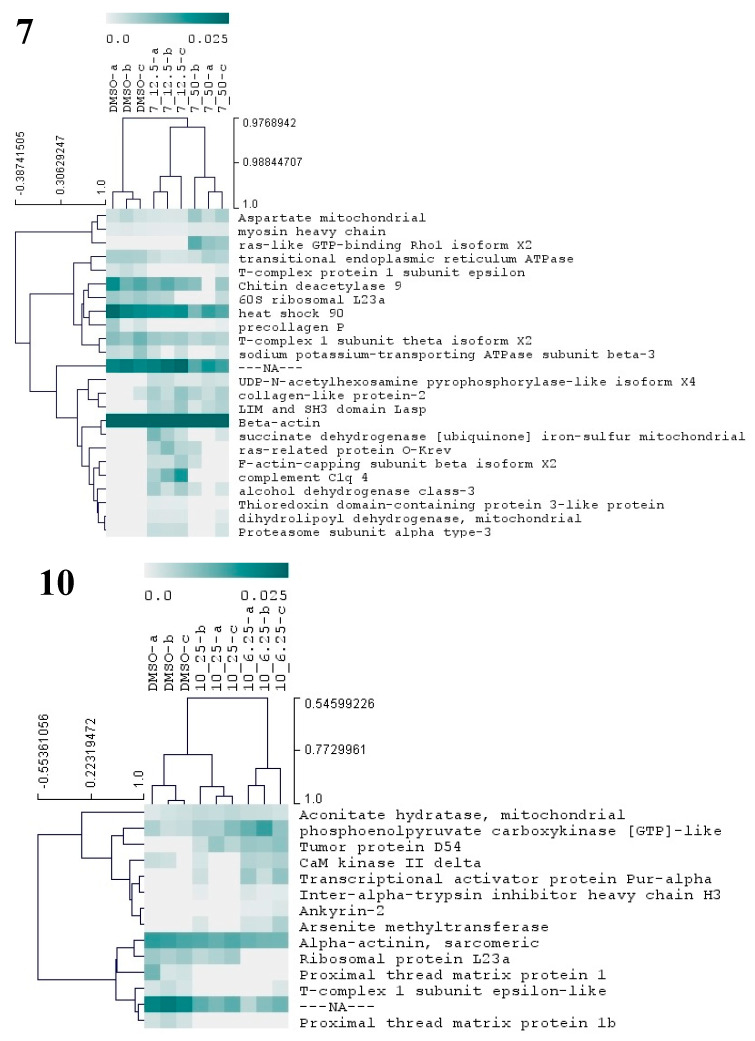
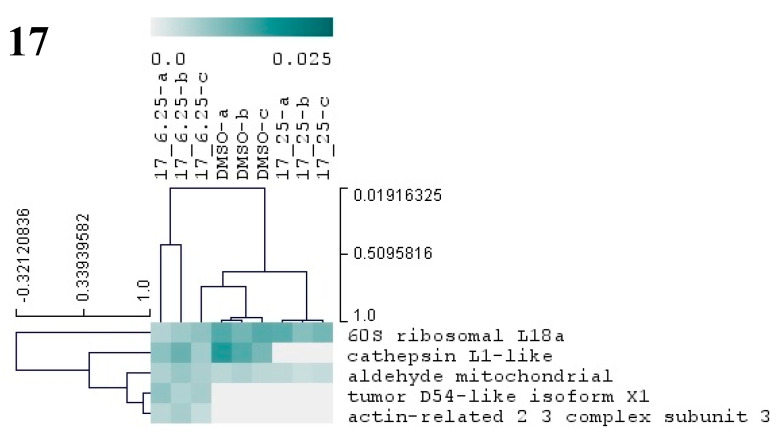
Figure 7.
Hierarchical cluster analysis of the differential proteins from M. galloprovincialis larvae exposed to three different antifouling compounds, 7, 10, and 17. On the vertical axis of the dendrogram: clustering of proteins with similar abundance profiles. On the horizontal axis: grouping of samples with similar proteome. Only proteins with significant changes (p < 0.05) in abundance (based on NSAF values) are presented in the dendogram. The relative abundance values (NSAF) are represented in color gradient from 0.0 to 0.025. Further information on NSAF values, significant p-values, and names of all differentially abundant proteins is included in Supplementary Table S2.


