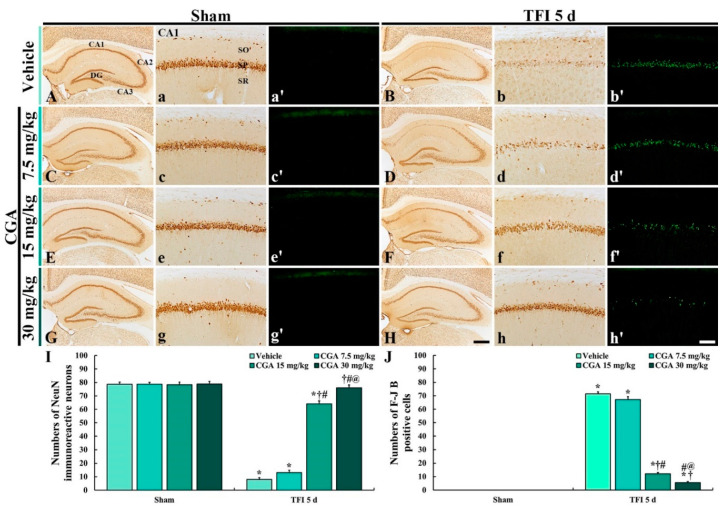
Figure 2.
NeuN immunohistochemistry (A–H,A(a)–H(h)) and (F–J) B histofluorescence (A(a’)–H(h’)) in the hippocampus (A–H) and CA1 region (A(a)–H(h),A(a’)–H(h’)) of the vehicle/sham and vehicle/TFI (A(a,a’),B(b,b’)), 7.5 mg/kg CGA/sham and CGA/TFI (C(c,c’),D(d,d’)), 15 mg/kg CGA/sham and CGA /TFI (E(e,e’), F(f,f’) and 30 mg/kg CGA/sham and CGA/TFI (G(g,g’),H(h,h’)) groups at 5 days after TFI. NeuN+ neurons are markedly reduced in the stratum pyramidale (SP) of the CA1 region of the vehicle/TFI group. Numerous F-J B+ cells are observed in the SP of the vehicle/TFI, 7.5 mg/kg CGA/TFI and 15 mg/kg CGA/TFI groups. In the 30 mg/kg CGA/TFI group, numerous NeuN+ neurons and no F-J B+ cells are detected in the SP. DG, dentate gyrus; SO, stratum oriens; SP, stratum pyramidale; SR, stratum radiatum. Scale bars = 400 μm (A–H) 40 μm (A(a)–H(h),A(a’)–H(h’)). I and J: mean numbers of NeuN+ (I) and F-J B+ cells (J) in the SP of the CA1 region. The bars indicate the means ± SEM (n = 7 in each group, * p < 0.05 vs. the corresponding sham group, †p < 0.05 vs. the vehicle/TFI group, # p < 0.05 vs. the 7.5 mg/kg CGA/TFI group, @ p < 0.05 vs. the 15 mg/kg CGA/TFI group).

