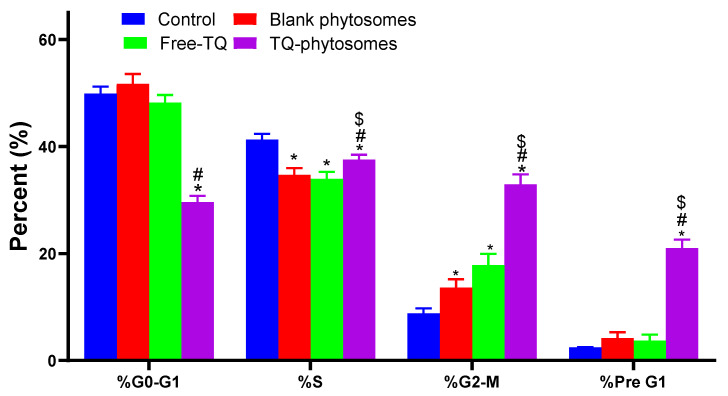
Figure 6.
Flow cytometric analysis of free-TQ, blank-phytosomes, and TQ-phytosomes on the cell cycle distribution of A549 cells. * represents significant difference from control (p < 0.05), # represents significant difference from free-TQ (p < 0.05) whereas $ represents significant difference from free-TQ (p < 0.05).

