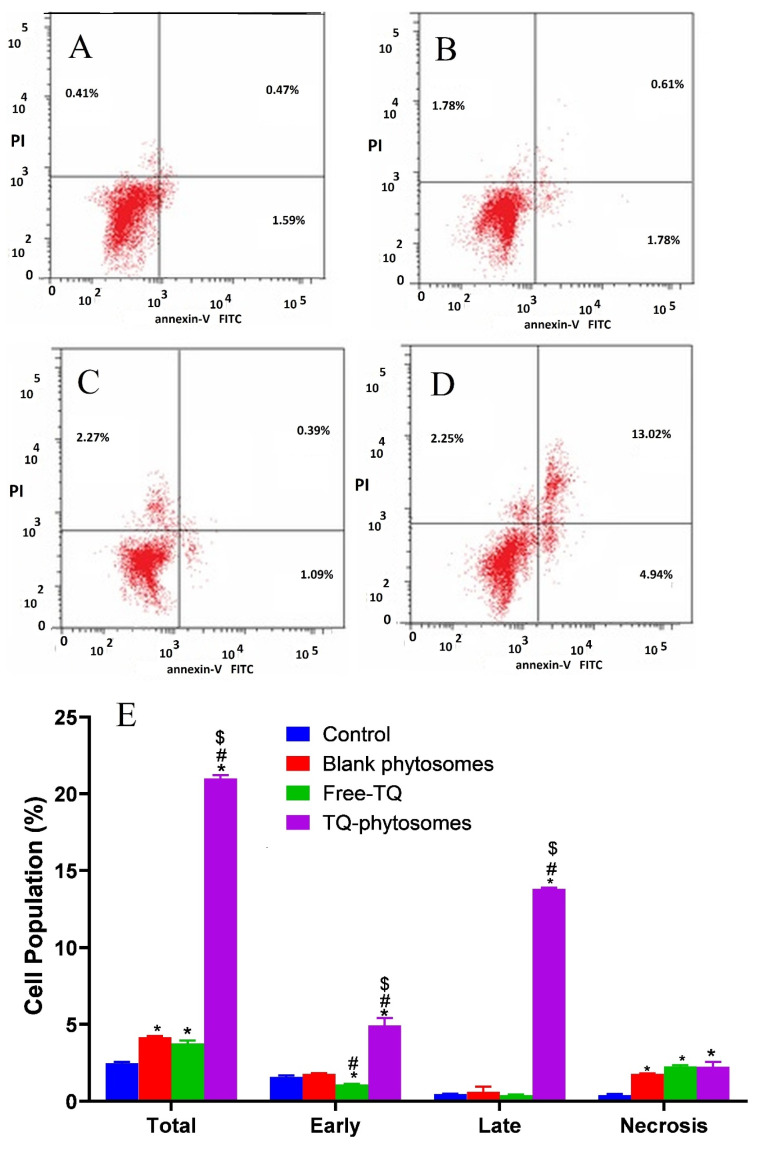
Figure 7.
(A–D)Apoptotic and necrotic assessment of free-TQ, blank-phytosomes, and TQ-phytosomes in A549 cells. The cells were exposed to the samples for 24 h and stained with annexin-V/FITC and propidium iodide and are plotted. (E) Representation of A549 cell death following apoptotic and necrotic assay by cytometric analysis after annexin V staining. * represents significant difference from control (p < 0.05), # represents significant difference from free-TQ (p < 0.05), whereas $ represents significant difference from free-TQ (p < 0.05).

