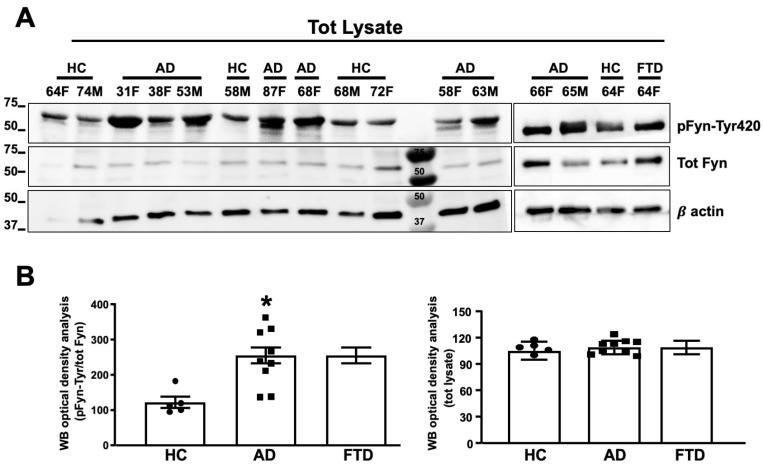
Figure 6.
Fyn was activated in neurons from AD patients. (A) Fyn TK activity, expressed as an increase in pFyn-Tyr420 relative to total Fyn, was assessed by WB using the rabbit anti-pFyn-Tyr420 antibody and rabbit anti-Fyn antibody. The increase in Fyn TK activity was calculated as a ratio of pFyn-Tyr420 levels relative to basal Fyn levels and expressed as % of healthy control (HC). The optical density analysis of pFyn-Tyr420/Fyn is shown in (B). Basal Fyn levels were normalized to β-actin and are expressed as a percentage of HC. Experiments from each sample were repeated three times, n = 3). * p < 0.05 vs. HC. Statistically significant differences were calculated using Student’s t-test. Note that the experiments reported in Figure 5 and Figure 6 were performed blind and HC 64F has been loaded two times (right and left panels).

