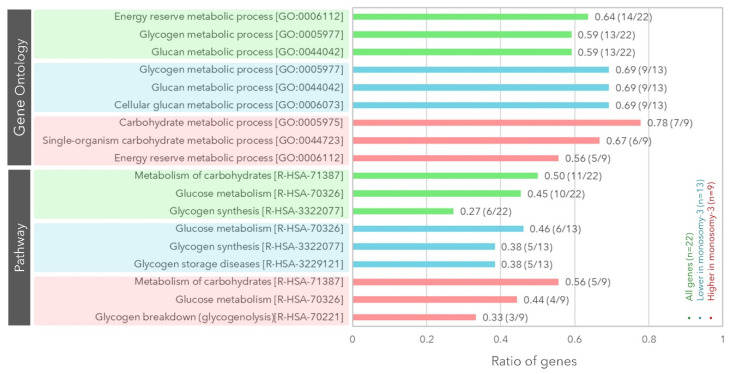
Figure 1.
Gene set enrichment analysis demonstrating the gene ontology terms and biological pathways that were over-represented among the differentially expressed genes in the monosomy-3 tumors. The differentially expressed genes (n = 22) are collectively presented in green, whereas the down- and up-regulated genes in the monosomy-3 tumors are indicated in blue vs. red, respectively. The y-axis lists the Gene Ontology terms and Reactome pathways that were most enriched among the subgroups of genes, while the x-axis represents the ratio of genes within a subgroup that were mapping to these functional classifications. The ratio and number of genes are stated adjacent to the bar plots. The accession numbers for the Gene Ontology terms and Reactome pathways are indicated in square brackets. All the p-values and false discovery rates were <0.001.

