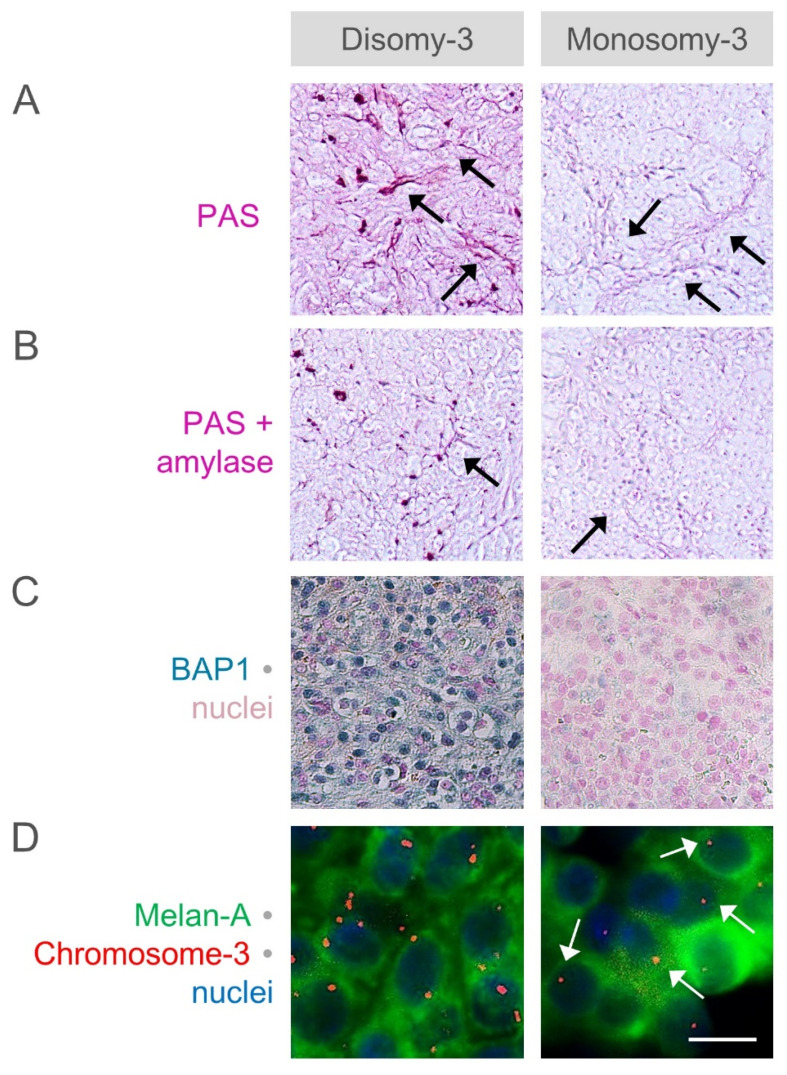
Figure 6.
Estimated levels of amylase-sensitive glycogen with regard to the monosomy-3 status and nuclear BAP1 expression. The difference in the intensity of the periodic acid-Schiff (PAS) stainings (A) without and (B) with amylase pretreatment was taken as the amount of amylase-sensitive glycogen. The amylase pretreatment has also led to a weakening in the staining of the extracellular arcs (black arrows). Original magnification: 100×. (C) Expression of BAP1 was analyzed by immunohistochemistry and staining of the nuclei with nuclear fast red. Original magnification: 200×. (D) The copy number of chromosome-3 (red) together with the melanoma marker protein Melan-A (green) was determined by performing a combined immunostaining with fluorescent in situ hybridization (Immuno-FISH) on the paraffin sections. Nuclei were counterstained in blue with 4′,6-diamidino-2-phenylindole. Arrows indicate several cells with monosomy-3. Scale bar = 10 µm.

