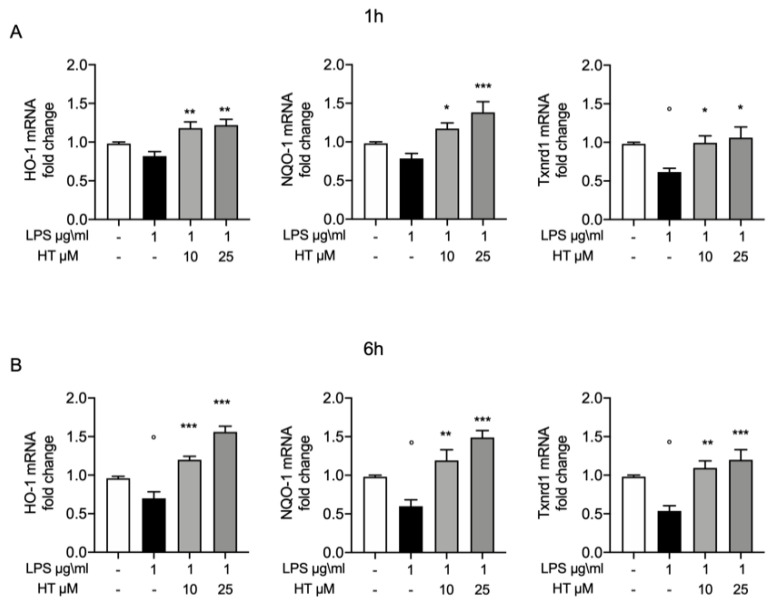
Figure 5.
(A) Protective effect of HT in LPS induced oxidative stress in MAC-T cell: mRNA levels of HO-1, NQO-1 and Txnrd1 one hour post LPS 1 μg/mL stimulation and 10-μM and 25-μM HT treatment; (B) mRNA levels of HO-1, NQO-1 and Txnrd1 six hours post LPS 1-μg/mL stimulation and 10-μM and 25-μM HT treatment. Data representative of at least three experiments, means ± SEM; ° p < 0.05 vs. control; * p < 0.05 vs. LPS; ** p < 0.01 vs. LPS; *** p < 0.001 vs. LPS.

