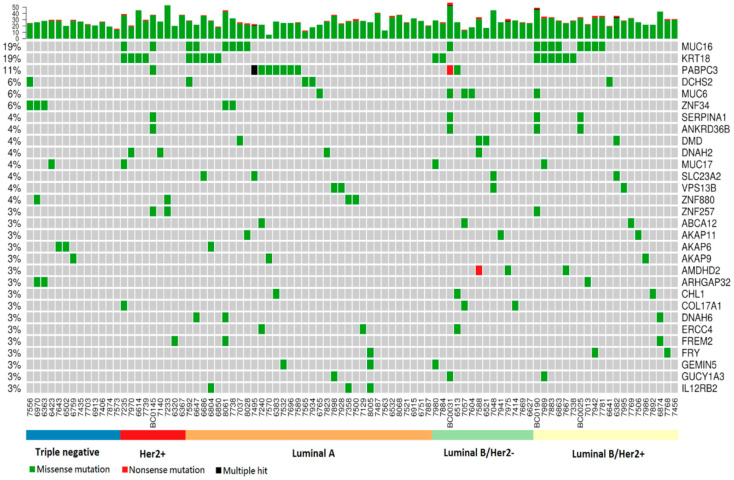
Figure 3.
Genes with germline mutations among the 90-patient EOBC cohort. (Top) Each bar represents the number of mutations for a patient; (Central panel) Patient mutated genes are labeled with various colors, each representing a particular type of germline mutation. The names of the mutated genes are listed on the right, with the corresponding prevalence shown on the left side.

