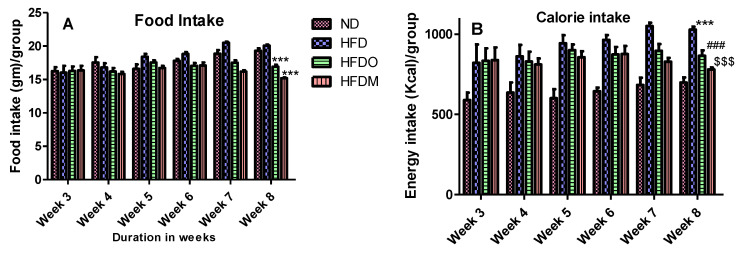
Figure 4.
(A) Food intake and (B) calorie intake during the study (N = 5). The HFDO- and HFDM-treated groups showed significantly lower food and calorie intake at the end of the study. For figure (A) *** p < 0.001 between HFD and HFDO, and HFD and HFDM. For figure (B) *** p < 0.01 between ND and HFD, ### p < 0.001 between HFD and HFDO, $$$ p < 0.001 between HFD and HFDM.

